Findings from The 2014 Survey of Nephrology Fellows
Detailed Analysis of the Inaugural ASN Fellow Survey
Edward Salsberg, MPA
George Washington University School of Nursing
Leah Masselink, PhD
Xiaoli Wu, MS
George Washington University Milken Institute School of Public Health
Preface
A survey of individuals training in a specialty or discipline can provide a good picture of the future supply, including their education and demographic characteristics. In addition, the experience of new entrants into the job market can provide a valuable snapshot of the demand nationally and in different settings and regions. If the survey is conducted on an annual or biennial basis, trends in supply and demand can be assessed.
The George Washington University research team working closely with the American Society of Nephrology (ASN) conducted an online survey of current nephrology fellows and trainees to obtain data on demographic and educational background, educational debt, career plans, job search experience, and factors influencing job opportunities and choices. The survey tool—adapted from the University at Albany Center for Health Workforce Studies (CHWS) annual NY State Resident Exit Survey—was distributed to the 1530 ASN nephrology fellow and trainee members (to whom ASN offers free membership) in June and July 2014. Of these, 441 fellows or trainees provided informed consent and responded to the survey questions for an overall response rate of 28.8%. Among the 930 fellows in their 1st and 2nd year of Accreditation Council for Graduate Medical Education (ACGME)–accredited training programs, we received responses from 333 fellows (a response rate of 35.8%).
This report presents demographic information for respondents in all years of fellowship and training, as well as the job market experiences and plans of fellows in their 2nd year of fellowship or beyond. For all of the statistical tests presented, we considered probability values <0.05 to be statistically significant.
Key Findings
Background of Respondents
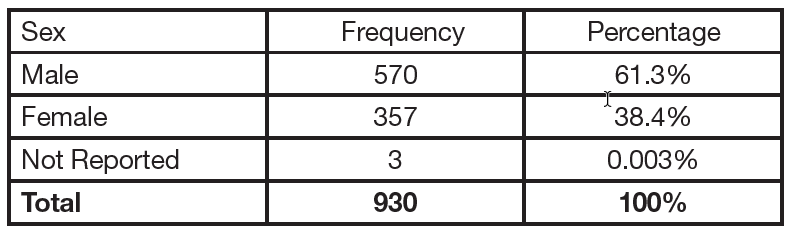
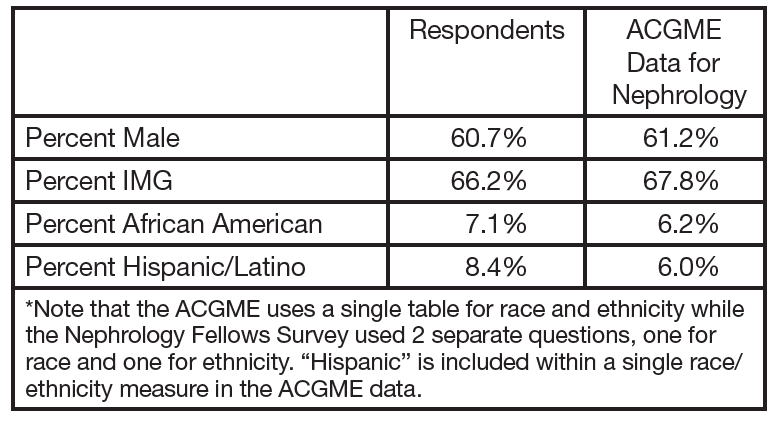
61% of respondents in their 1st or 2nd years of fellowship were male, consistent with ACGME data. There was a significant difference among US medical graduates (USMGs) and international medical graduates (IMGs): USMGs were 54% female; IMGs were only 32% female.
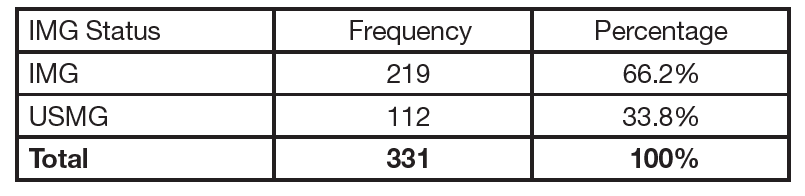
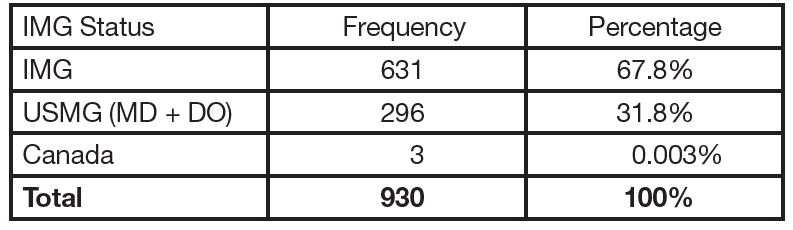
64% of respondents were IMGs, consistent with data reported by ACGME.
Among native-born US citizens, about 10% appear to be US IMGs.
Non–native-born respondents were nearly evenly divided among naturalized, permanent resident, H visa holders, and J visa holders.
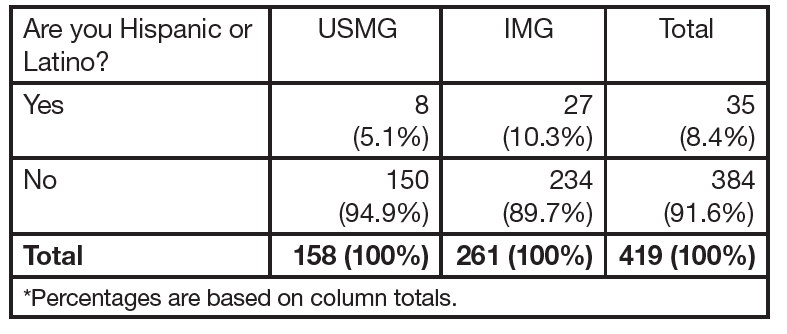
9% of USMGs were African American, 8% of all fellows were Hispanic, and IMGs were significantly more likely to be Asian than USMGs.
USMGs had a median debt of $100,000 to $149,999. IMGs were significantly different with a median debt of $0 and 65% having no debt.
Post-Training Plans
Among respondents in their 2nd year of fellowship or beyond, the largest proportions indicated they planned to enter clinical nephrology practice (37%) and positions that combined clinical nephrology practice with teaching and/or research (24%). An additional 7% indicated they were going to enter a mixed nephrology/internal medicine practice.
Among respondents who had already accepted job offers in patient care, more than one-half reported that they planned to work in nephrology group practice. Another 15% reported that they planned to work in faculty practice plans.
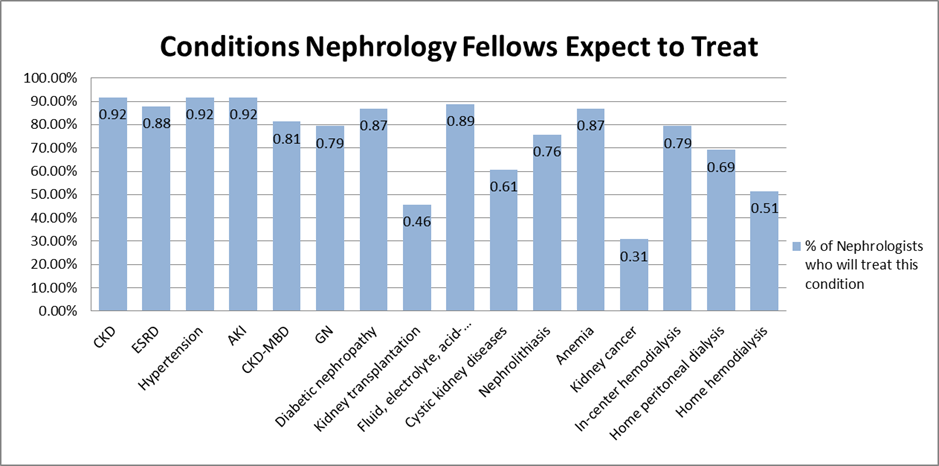
More than 80% of respondents indicated that they expected to treat chronic kidney disease (CKD), hypertension, acute kidney injury (AKI), fluid/electrolyte/ acid-base disorders, end stage renal disease (ESRD), diabetic nephropathy, and anemia. The least frequently expected conditions were kidney cancer (31%) and kidney transplantation (46%).
Among dialysis modalities, respondents who had accepted job offers were most likely to expect to deal with in-center hemodialysis (79%), followed by home peritoneal dialysis (69%) and home hemodialysis (51%).
Among respondents who were in their 2nd year of fellowship or beyond, about 14% (25 of 175 respondents) reported that they had obligations to work in federally designated Health Professional Shortage Areas (HPSAs). All of the respondents who reported obligations to work in HPSAs were IMGs reflecting their need to be in a HPSA in order to stay in the United States given their visa category.
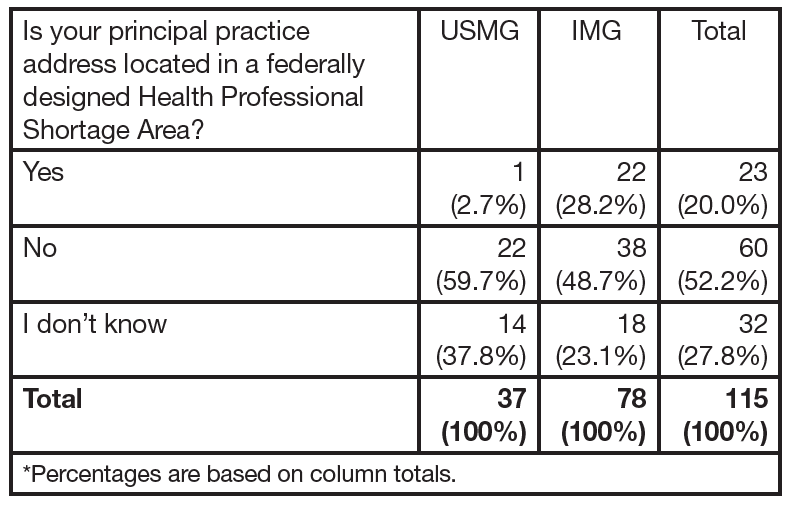
Among respondents who had already accepted jobs, 20% (23 of 115 respondents) reported that their principal practice address was located in a HPSA. Nearly all of these (22 of 23 respondents) were IMGs.
Job Market Experiences
Male fellows were more likely to rate salary and compensation as very important or important than female fellows. There was a statistically significant difference between male and female fellows’ satisfaction: female fellows (86%) were more likely than male fellows (62%) to indicate that they were “very satisfied” or “satisfied” with their salary and compensation.
There was little difference in the median anticipated base incomes across demographic groups (male/ female and USMG/IMG fellows). Female respondents (both IMGs and USMGs) had a slightly higher median anticipated base income ($175,000 to $199,999) than male respondents (both IMGs and USMGs), who had a median anticipated base income of $150,000 to $174,999.
A substantial proportion of nephrology fellows (43%) who had looked for jobs reported that they had changed their plans because of limited practice opportunities.
IMGs were more likely to report difficulties in finding a satisfactory position (56%) than USMGs (22%).
We found a statistically significant difference in reasons for difficulty finding a position between IMG and USMG fellows: IMGs were more likely than USMGs to note a lack of jobs that meet visa requirements (33% vs. 0%), and USMGs were more likely than IMGs to note a lack of jobs in desired locations (54% vs. 27%).
A statistically significant difference existed in the number of job applications between IMG and USMG fellows: IMGs were more likely than USMGs to apply for >10 jobs (19% vs. 2%), although patterns across other ranges were less consistent.
Nephrology fellows’ perceptions of local nephrology job opportunities were disappointing: 71% reported that there were no, very few, or few nephrology practice opportunities within 50 miles of their training sites.
Nephrology fellows perceived national nephrology job opportunities much more positively than local opportunities—53% reported there were some or many nephrology practice opportunities nationally.
The study found a statistically significant difference in IMG and USMG fellows’ assessments of national nephrology practice opportunities: IMGs were more likely than USMGs to report that there were no, very few, or few job opportunities available (51% vs. 25%), and USMGs were more likely than IMGs to report some or many job opportunities nationally (66% vs. 45%).
The vast majority of fellows (72%) indicated that they would recommend the specialty to medical students or internal medicine residents. While 82% of USMG fellows indicated that they would recommend the specialty, only 65% of IMG fellows indicated the same.
Overview of Respondents
The 441 respondents who provided information on the survey included fellows in their 1st and 2nd year of their ACGME-accredited training program, as well as 3rd, 4th, and 5th year fellows in sub-specialty training or research positions. Of the 441 respondents, 192 had completed their basic nephrology training; 131 had searched for a job; and 115 had found a position. Different sections of this report present findings on each of these groups of fellows.
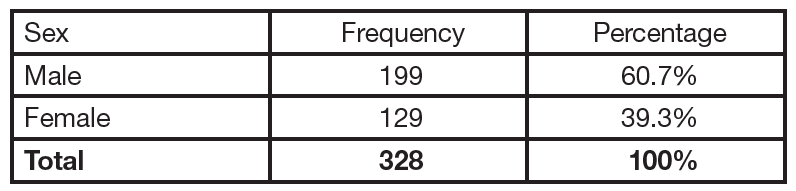
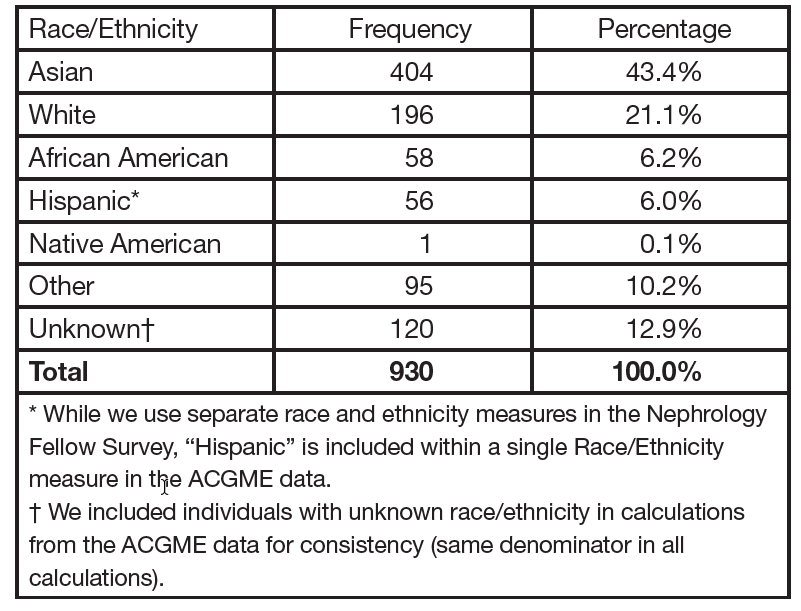
Based on a comparison of the demographic and educational characteristics of the 328 respondents in their 1st and 2nd year of training to ACGME data on all 930 1st and 2nd year nephrology fellows, the survey respondents have very similar characteristics to all 1st and 2nd year nephrology fellows as indicated in Exhibit 1. (See Appendix for additional detail.)
Education, Citizenship Status, and Demographics of Respondents
This section presents data on the educational background, citizenship status, and demographics of all respondents (441 fellows).
Location of Medical School
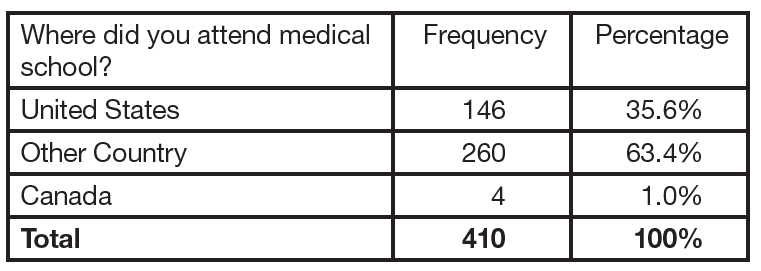
Most survey respondents indicated they were IMGs (graduates of medical schools outside the United States). A small number (1%) were educated in Canada, but most (63.4%) were educated in other countries. The most frequently cited countries of medical education included India (87 respondents) and Pakistan (17 respondents). All other countries of medical education had fewer than 10 respondents each.
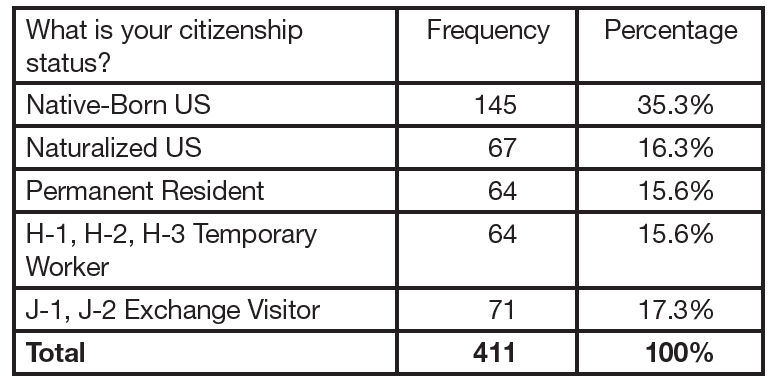
About one-half of the respondents reported that they were US citizens, either native born or naturalized, and nearly 16% reported that they were permanent residents of the United States. About one-third of the respondents were non-citizen holders of either H or J visas.
While the data did not enable a precise identification of US IMGs (citizens/residents of the United States who received their medical education in another country), a small number of respondents who may fit into this category were observed: 14 of the 145 respondents who identified themselves as native-born US citizens reported that they had received their medical education in another country.
Sex
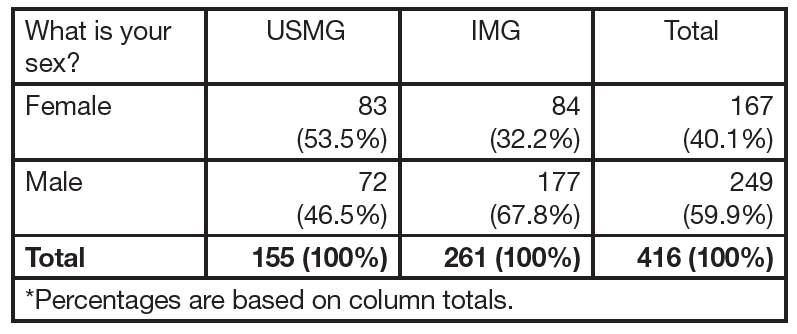
The majority of respondents (about 60%) were male. IMGs were significantly more likely to be male (67.8%) than USMGs (46.5%) (p<0.01). But even among female respondents, more than one-half indicated that they were IMGs.
Age
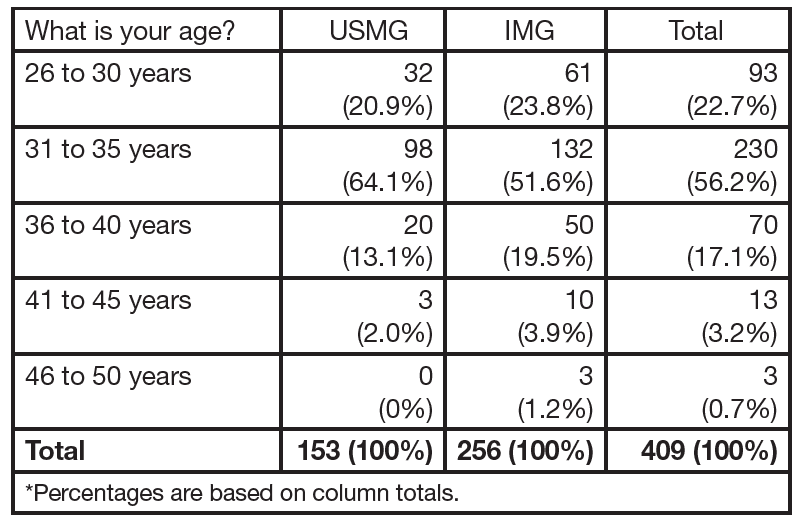
Respondents ranged in age from 27 to 49 years old. The largest group was ages 31 to 35, which included over onehalf of the respondents. IMG respondents were significantly older than USMG respondents on average (33.6 years old vs. 32.8 years old, p=0.01).
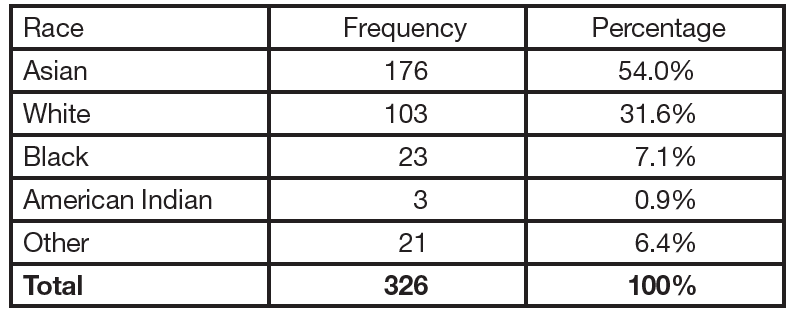
Race/Ethnicity
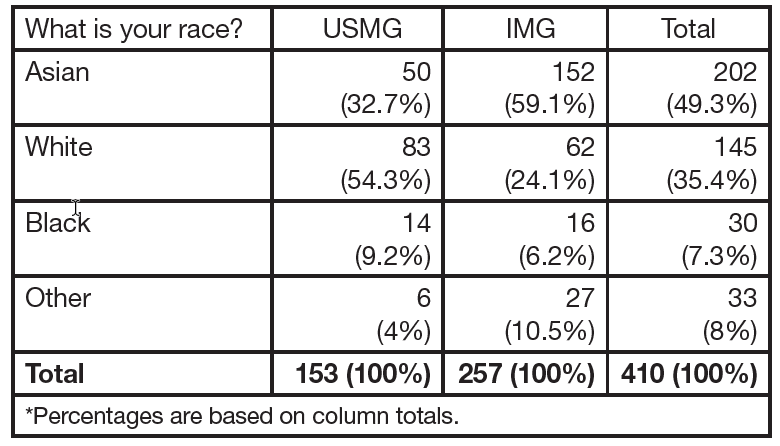
Nearly one-half of the respondents identified themselves as Asian, and an additional 35% of respondents identified themselves as white. The distribution of race/ethnicity was significantly different across IMG categories (p<0.01): IMGs were more likely to be Asian or of “other” race than USMGs, and USMGs were more likely to be white or black than IMGs.
A number of respondents (35 of 419 [8.4%]) identified themselves as Hispanic or Latino. IMG respondents were more likely to identify themselves as Hispanic or Latino than USMG respondents; the difference approached statistical significance (p=0.06).
Educational Debt
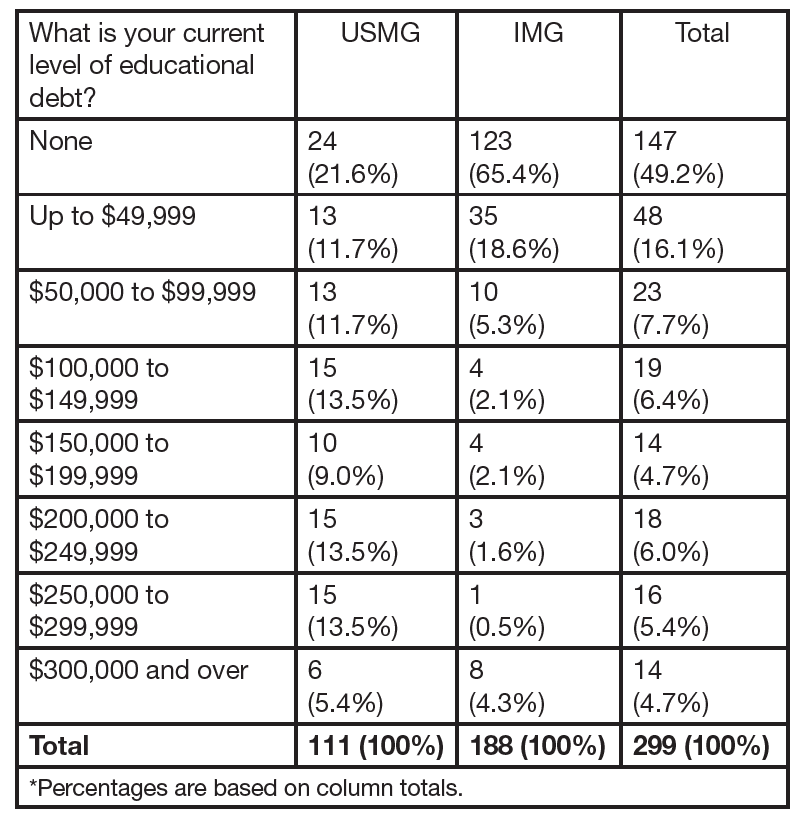
Respondents’ reported levels of educational debt varied from no debt to over $300,000. IMG respondents were significantly more likely to report having no educational debt than USMG respondents (p<0.01), and an additional 19% of IMGs reported educational debt levels below $50,000. USMG respondents were more likely than IMGs to report debt levels over $50,000. (In fact, USMGs were overrepresented relative to the total sample in every debt tier over $50,000.) IMG respondents had a median educational debt of $0, while USMG respondents had a median educational debt of $100,000 to $149,999.
Post-Training Plans (2nd Year & Beyond Fellows Only)
Activity After Completion of Current Training Program
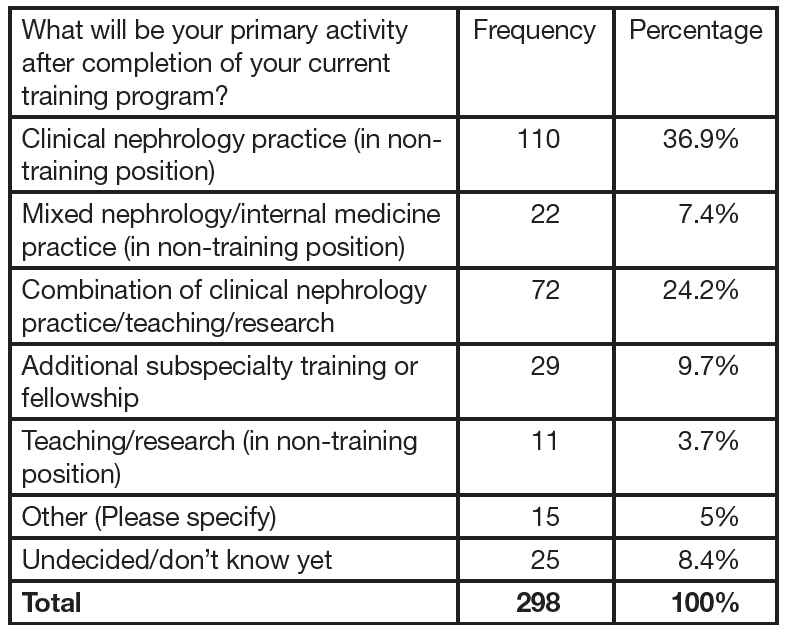
Among respondents in their 2nd year of fellowship or beyond (n=298), the largest proportions indicated that they planned to enter clinical nephrology practice (37%) and positions that combined clinical nephrology practice with teaching and/or research (24%). Nearly 10% (29 respondents) indicated that they planned to pursue additional subspecialty or fellowship training. Among these 29 respondents, 17 respondents indicated that they planned to pursue training in transplant nephrology. Others described a variety of training foci, including research, interventional nephrology, and critical care.
We found no significant differences in the distribution of practice activity between male and female fellows (p=0.41), USMG and IMG fellows (p=0.09), or US residents/citizens and visa holders (p=0.83).
Future Patient Care Practice
Practice Setting
Among respondents who had already accepted job offers in patient care (n=115), more than one-half reported that they planned to work in nephrology group practice. Another 15% reported that they planned to work in faculty practice plans. The number of respondents who planned to work as hospitalists was relatively small (8 fellows [7% of respondents]).
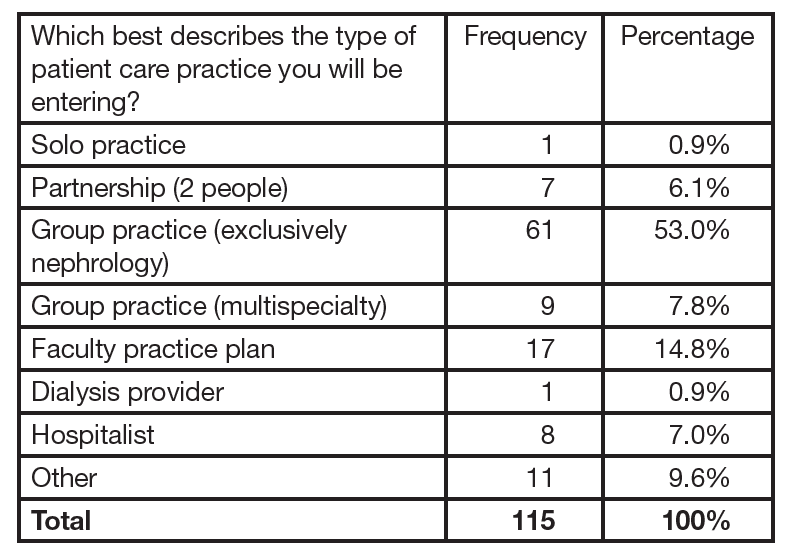
We found no significant differences in the distribution of patient care settings between male and female fellows (p=0.36), USMG and IMG fellows (p=0.13), or US residents/citizens and visa holders (p=0.83). Conditions Fellows Expect to Treat Most of the 115 respondents who had accepted job offers reported that they expected to treat a broad variety of kidney conditions in their future work. The most frequently cited conditions that respondents expected to treat were CKD, hypertension, AKI, fluid/electrolyte/acid-base disorders, ESRD, diabetic nephropathy, and anemia. Over 80% of respondents indicated that they expected to treat each of these conditions. The least frequently expected conditions were kidney cancer (31%) and kidney transplantation (46%). Among dialysis modalities, respondents who had accepted job offers were most likely to expect to deal with in-center hemodialysis (79%), followed by home peritoneal dialysis (69%) and home hemodialysis (51%).
Location of Practice
Among respondents who had completed their training and reported the locations they intended to practice (n=164), more than one-half (58%) planned to conduct their primary post-training activity in the same census region as their training programs. We found a significant difference between IMG and USMG fellows’ plans (p=0.003): USMGs were more likely to plan to stay in the same census region than IMGs. We found no significant difference between male and female fellows’ plans to stay or leave their training census region (p=0.99).
Among respondents who had accepted job offers, a similar proportion (57%) planned to work in the same census region as their training programs. Again, we found a significant difference between IMG and USMG fellows’ plans (p=0.05): USMGs were more likely to stay in their training region than IMGs. We found no significant difference between male and female fellows’ likelihood of working in the same census region as their training program (p=0.28).
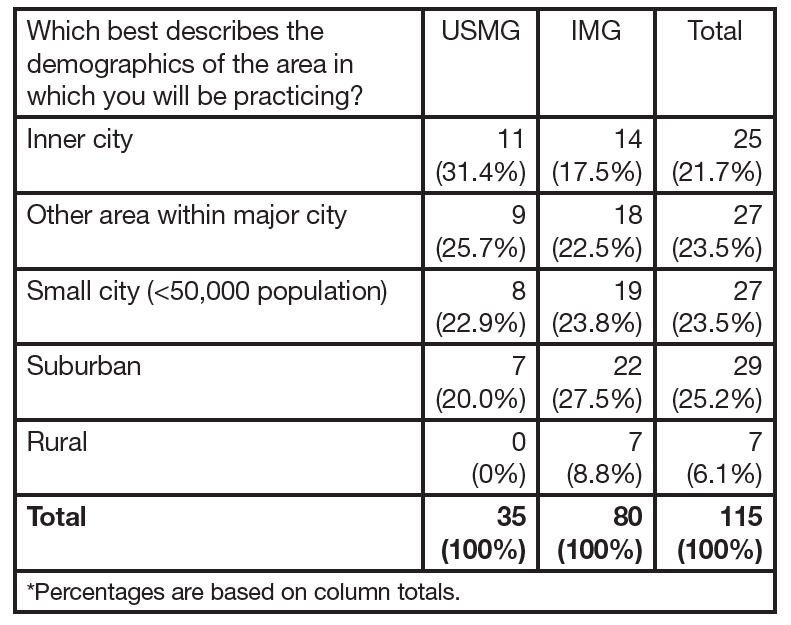
Among fellows who had accepted job offers, the vast majority (94%) planned to work in urban or suburban areas. They were approximately evenly distributed across inner cities, other city locations, small cities, and suburban locations. Only 6% of fellows planned to work in rural areas. While the difference in the overall distribution of USMG and IMG respondents across practice locations was not statistically significant (p=0.21), it is notable that all of the fellows who had accepted jobs in rural areas were IMGs. Although there were no USMGs in rural communities, this is not surprising given the need for a minimum population for a full-time nephrology practice.
Practice in Underserved Areas
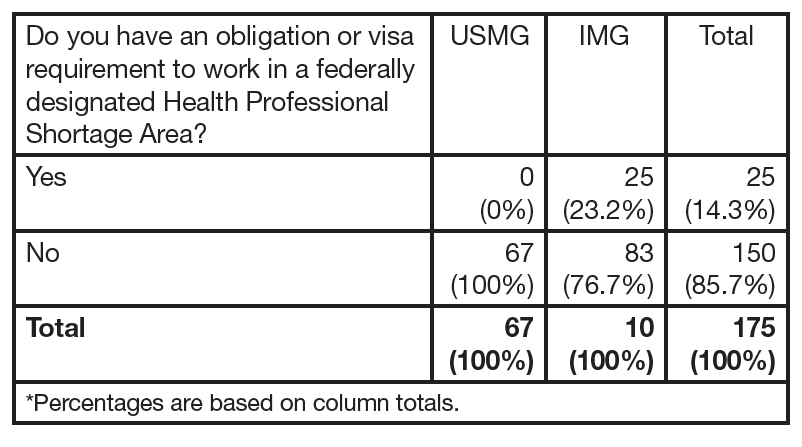
Among respondents who were in their 2nd year of fellowship or beyond, about 14% (25 of 175 respondents) reported that they had obligations to work in federally designated Health Professional Shortage Areas (HPSAs). All of the respondents who reported obligations to work in HPSAs were IMGs, so the difference in the overall distribution of service obligations by IMG status was highly significant (p<0.01).
Among the 115 respondents who had already accepted jobs, 20% (23 respondents) reported that their principal practice address was located in a HPSA. Nearly all of these (22 of 23 respondents) were IMGs, and the difference in distribution of IMGs’ and USMGs’ practice locations was highly significant (p<0.01).
Job Search and Marketplace
Factors Influencing Job Selection and Practice Location
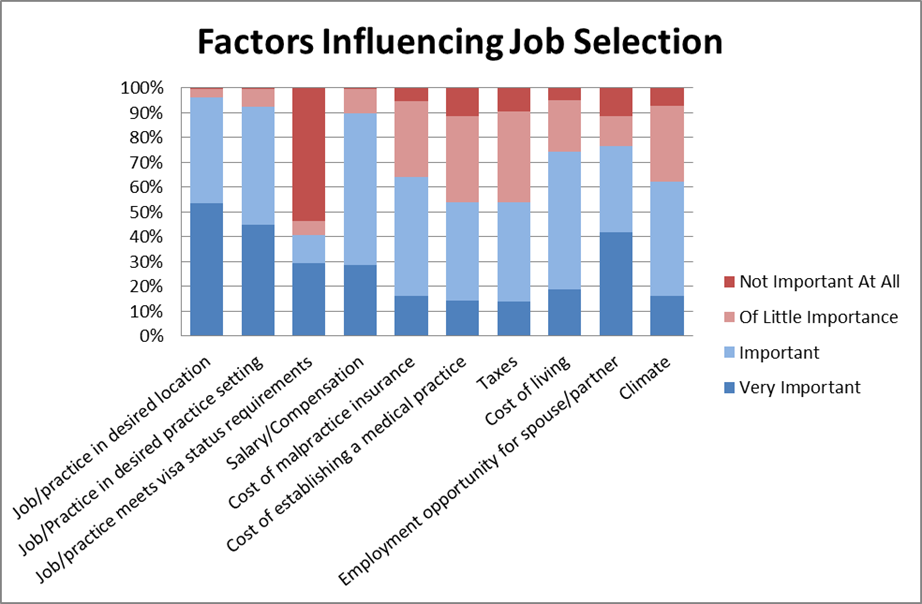
Approximately 290 fellows completed the influencing factors section, but exact numbers vary for each question. Respondents rated job/practice in desired location, job/practice in in desired practice setting, and salary/ compensation as the most important factors influencing their job selection overall. They rated whether a job/practice meets visa status requirements as least important overall.
We found no significant difference in respondents’ ratings of the importance of job/practice in desired location by sex (p=0.07). We found a significant difference by IMG status (p=0.01). USMG respondents were more likely than IMGs to report that having a job or practice in a desired location was very important. We found no significant difference in respondents’ ratings of the importance of job/practice in desired practice setting by sex (p=0.14) or by IMG status (p=0.68).
Not surprisingly, IMG respondents were much more likely to rate having a job/practice that met visa status requirements as very important or important than USMGs (p<0.01). We found no significant difference in respondents’ ratings of the importance of visa status requirements by sex (p=0.18).
We found a significant difference in respondents’ ratings of the importance of salary and compensation by sex (p=0.01): male fellows were more likely to rate salary and compensation as very important or important than female fellows. We found no significant difference in respondents’ ratings of the importance of salary/compensation by IMG status (p=0.09).
We found significant differences between IMG and USMG respondents’ ratings of the importance of several types of costs related to their future practice:
Cost of malpractice insurance: IMGs were more likely to report that cost of malpractice insurance was very important or important than USMGs (p<0.01).
Cost of establishing a medical practice: IMGs were more likely to report that cost of establishing a practice is very important or important than USMGs (p<0.01).
Taxes: IMGs were more likely to report that taxes were very important or important than USMGs (p<0.01).
Cost of living: IMGs were more likely to report that cost of living was very important or important than USMGs, and USMGs were more likely to report that cost of living was not important at all than IMGs (p=0.03).
No significant differences existed between male and female respondents’ ratings of the same costs: cost of malpractice insurance (p=0.81), cost of establishing a medical practice (p=0.73), taxes (p=0.83) and cost of living (p=0.70).
We found significant differences in respondents’ ratings of the importance of employment opportunities for their spouses or partners by sex (p=0.001) and IMG status (p=0.02). Female respondents were more likely to rate employment opportunities for their spouses or partners as very important and not important at all than male fellows. IMG respondents were more likely to report that opportunities for spouses/partners were very important than USMG respondents, and USMG respondents more likely to report that opportunities for their spouses/partners were not important at all.
Finally, a significant difference existed in IMG and USMG respondents’ ratings of the importance of the climate of their job location (p=0.03). IMGs were more likely to report that climate was very important or important than USMGs. We found no significant difference in male and female respondents’ ratings of the importance of the climate of their job location (p=0.96).
Expected Income
Respondents who had accepted job offers (n=115) expected to earn base salaries ranging from less than $100,000 (12 respondents [10.8%]) to more than $350,000 (1 respondent [0.9%]). The most frequently reported expected base income categories were $175,000 to $199,999 (37 respondents [33.3%]) and $150,000 to $174,999 (32 respondents [28.8%]).
Respondents who had accepted job offers expected additional incentive income ranging from $0 (53 respondents [48.2%]) to $60,000 and more (4 respondents [3.6%]). The most frequently reported expected additional incentive income categories were $0, $5000 to $9999 (17 respondents [15.5%]), and less than $5000 (9 respondents [8.2%]).
Exhibit 16 shows median expected base income and expected incentive income for fellows who had accepted by practice locations.
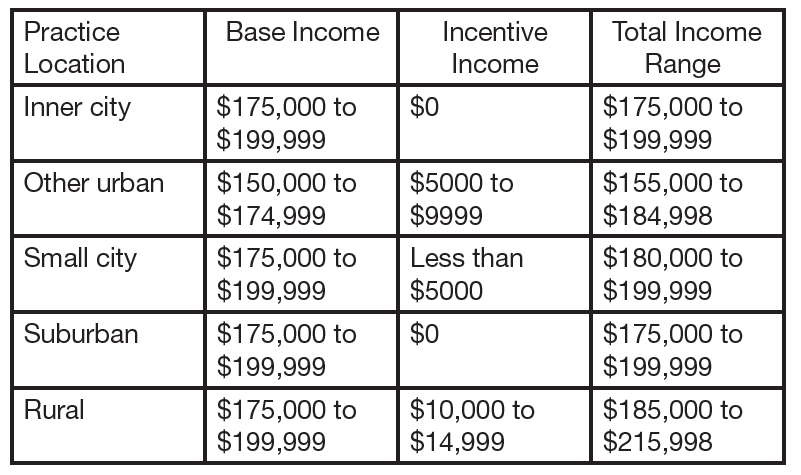
Since the data only provided ranges of base and additional incentive income for fellows who had accepted job offers, we were only able to determine medians (not means) across practice setting locations. Base incomes were similar across most locations: respondents planning to work in all locations except “other urban” (non–inner city) had median expected base incomes of $175,000 to $199,999. (“Other urban” was slightly lower at $150,000 to $174,999.) Median incentive incomes ranged from $0 in suburban locations to $10,000 to $14,999 in rural locations. The combined median plus additional incentive range for respondents in rural locations was the highest among all practice locations.
Distribution by Sex & IMG Status
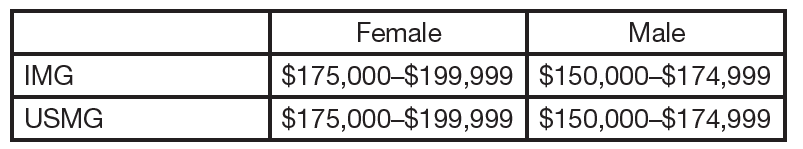
We found little difference in the median anticipated base incomes across demographic groups (male/female and USMG/IMG fellows). Female respondents (both IMGs and USMGs) had a slightly higher median anticipated base income ($175,000 to $199,999) than male respondents (both IMGs and USMGs), who had a median anticipated base income of $150,000 to $174,999.

Additional incentive income was somewhat more varied across demographic groups (male/female and USMG/IMG fellows). Female IMGs had the highest anticipated median incentive income ($5000 to $9999), and male USMGs had the lowest anticipated median incentive income ($0).
Job Market Experiences & Perceptions
We tested for differences in the job market experiences of fellows who had completed 2 or more years of training across three key categories:
Male vs. female fellows
USMGs vs. IMGs
Census regions (Northeast vs. Midwest vs. South vs. West)
Job Search Experiences
Among the 187 2nd year and beyond nephrology fellows who indicated they had completed their basic nephrology training, we found the following with respect to their job search experiences.
Difficulty Finding a Satisfactory Position
Fellows’ experiences finding a satisfactory position were mixed: 43% reported they had difficulty finding a satisfactory practice position and 33% reported no difficulty. (The remaining 23% had not looked for a position yet.)
We found a statistically significant difference between male and female fellows’ reports of difficulty finding a position (p=0.03): more female fellows (32%) than male fellows (16%) had not looked for a position yet, and male fellows were more likely than female fellows to report difficulty finding a satisfactory position (49% vs. 35%).
A statistically significant difference also existed between IMG and USMG fellows’ reports of difficulty finding a position (p<0.01): USMGs were more likely not to have looked for a position than IMGs (33% vs. 18%), and IMGs were more likely to report difficulties in finding a satisfactory position (56% vs. 22%).
We found no statistically significant difference in reports of difficulty finding a position across census regions (p=0.12).
Reasons for Difficulty
Among the 76 fellows who reported difficulty finding a satisfactory position, the most frequently cited reasons were lack of jobs/practice opportunities in desired locations (32%) and lack of jobs/practice opportunities that meet visa status requirements (28%).
We found a statistically significant difference in reasons for difficulty finding a position between IMG and USMG fellows (p=0.04): IMGs were more likely than USMGs to note lack of jobs that meet visa requirements (33% vs. 0%), and USMGs were more likely than IMGs to note lack of jobs in desired locations (54% vs. 27%).
We found no statistically significant difference in the reasons for difficulty finding a position between male and female fellows (p=0.58) or across census regions (p=0.28).
Changing Plans due to Limited Practice Opportunities
A substantial proportion of nephrology fellows (43%) who had looked for jobs reported that they had changed their plans because of limited practice opportunities. We found no statistically significant differences in the degree to which fellows changed their plans between male and female fellows (p=0.44), IMGs and USMGs (p=0.19), or across census regions (p=0.39).
Number of Job Applications
Nephrology fellows’ reports of the numbers of job applications they had completed varied widely—60% applied for between 1 and 5 jobs, approximately 30% had applied for at least 6 jobs, and 10% had not applied for any jobs.
We found a statistically significant difference in the number of job applications between IMG and USMG fellows (p=0.02): IMGs were more likely than USMGs to apply for >10 jobs (19% vs. 2%), although patterns across other ranges were less consistent.
No statistically significant differences existed in the number of job applications between male and female fellows (p=0.48) or across census regions (p=0.36).
Number of Job Offers
The majority of nephrology fellows (71%) reported receiving between 1 and 3 job offers, and about 12% of fellows reported receiving no job offers.
We found a statistically significant difference in the number of job offers across census regions (p=0.05). Fellows in the West census region were more likely than fellows from other regions to have no job offers (23% vs. 8% of fellows across the other regions).
We found no statistically significant differences in the number of job offers between male and female fellows (p=0.16) or IMG and USMG fellows (p=0.48).
Job Offer Characteristics
Among 115 nephrology fellows who had already accepted job offers, we found the following with respect to their salary and compensation expectations.
Base Salary/Income
Fellows’ expected salaries ranged from <$100,000 to >$300,000. Among the fellows who had accepted job offers, >60% anticipated annual base salaries between $150,000 and $200,000, and another 11% expected salaries <$100,000.
We found no significant differences in expected salaries between male and female fellows (p=0.68), between IMGs and USMGs (p=0.18), or across census regions (p=0.40).
Anticipated Additional Incentive Income
Nearly one-half (48%) of fellows who had accepted job offers did not anticipate receiving any additional incentive income. Those expecting to receive incentive income reported a range of expected incentives from <$5000 to >$60,000.
We found no significant differences in expected salaries between male and female fellows (p=0.61), between IMGs and USMGs (p=0.62), or across census regions (p=0.77).
Satisfaction with Salary/Compensation
The majority of fellows who had accepted job offers indicated that they were satisfied with their salary and compensation. Approximately 26% reported being “very satisfied,” and 45% indicated that they were “somewhat satisfied” with their salary and compensation.
A statistically significant difference existed between male and female fellows’ satisfaction (p=0.01): female fellows (86%) were more likely than male fellows (62%) to indicate that they were “very satisfied” or “satisfied” with their salary and compensation.
There was no statistically significant difference in satisfaction with salary and compensation between IMGs and USMGs (p=0.72) or across census regions (p=0.41).
Job Market Perceptions
Finally, we found the following among 280 fellows in adult nephrology who had completed at least 2 years of fellowship training.
Local Job Market Perceptions
Nephrology fellows’ perceptions of local nephrology job opportunities were dim: 71% reported that there were no, very few, or few nephrology practice opportunities within 50 miles of their training sites. This may reflect the reality around many medical schools and teaching hospitals where former fellows have settled.
We found a statistically significant difference in IMG and USMG fellows’ assessments of local nephrology practice opportunities (p<0.01): IMGs were more likely than USMGs to report no job opportunities in their local area (16% vs. 4%), although the overall proportions reporting no-very few or few jobs were similar (70% of IMGs and 72% of USMGs). USMGs were slightly more likely than IMGs to report that there were some or many job opportunities available (25% vs. 21%).
We found no statistically significant differences in local job market perceptions between male and female fellows (p=0.45) and across census regions (p=0.51).
National Job Market Perceptions
Nephrology fellows perceived national nephrology job opportunities much more positively than local opportunities—53% reported there were some or many nephrology practice opportunities nationally.
We also found a statistically significant difference in IMG and USMG fellows’ assessments of national nephrology practice opportunities (p<0.01): IMGs were more likely than USMGs to report that there were no, very few, or few job opportunities available (51% vs. 25%), and USMGs were more likely than IMGs to report some or many job opportunities nationally (66% vs. 45%).
We found no statistically significant differences in national job market perceptions between male and female fellows (p=0.12) and across census regions (p=0.38).
These findings suggest that IMG nephrology fellows’ job market experiences were significantly less positive than USMGs. IMGs were significantly less optimistic than USMGs about their local or national job markets, and they were significantly more likely to report difficulty finding an acceptable position (possibly because of a lack of positions available to J-1 visa applicants). IMGs were also nearly twice as likely as USMGs to report that they did not recommend the specialty to others.
Appendix: Comparison of Respondents to ACGME Data on Nephrology Fellows