| Characteristic | Adult (N=400) | Pediatrics (N=41) | Adult/ Pediatrics (N=9) |
|---|---|---|---|
| Educational Status | |||
| USMG | 148 (37%) | 28 (68%) | 8 (89%) |
| IMG | 252 (63%) | 13 (32%) | 1 (11%) |
| Years of Training Completed | |||
| 1 | 176 (44%) | 10 (24%) | 2 (22%) |
| 2 | 215 (54%) | 14 (34%) | 3 (33%) |
| 3 | 7 (2%) | 17 (41%) | 2 (22%) |
| 4 or more | 2 (0%) | NA | 2 (22%) |
| Gender Identity | |||
| Man | 237 (59%) | 10 (24%) | 3 (33%) |
| Woman | 155 (39%) | 31 (76%) | 4 (44%) |
| Gender non-binary | 1 (0%) | NA | NA |
| Prefer not to answer | 6 (2%) | NA | 2 (22%) |
| Citizenship Status | |||
| U.S. citizen | 230 (57%) | 27 (66%) | 9 (100%) |
| Permanent resident | 35 (9%) | 6 (15%) | NA |
| H-1, H-2, or H-3 visa (temporary worker) | 37 (9%) | 1 (2%) | NA |
| J-1 or J-2 visa (exchange visitor) | 93 (23%) | 6 (15%) | NA |
| Other visa (Please specify your "other" visa type) | 2 (0%) | 1 (2%) | NA |
| Prefer not to answer | 3 (1%) | NA | NA |
| Ethnicity | |||
| Hispanic/Latina/Latino | 48 (12%) | 8 (20%) | 2 (22%) |
| Prefer not to answer | 10 (3%) | NA | 2 (22%) |
| Race† | |||
| American Indian or Alaska Native | 3 (1%) | 2 (5%) | 0 (0%) |
| Asian Total | 179 (44%) | 8 (18%) | 2 (22%) |
| –East Asian | 21 (5%) | 4 (9%) | 1 (11%) |
| –South Asian | 143 (35%) | 4 (9%) | 1 (11%) |
| –Southeast Asian | 15 (4%) | 0 (0%) | 0 (0%) |
| Black or African American | 39 (10%) | 1 (2%) | 0 (0%) |
| Pacific Islander | 1 (0%) | 0 (0%) | 0 (0%) |
| Prefer not to answer | 31 (8%) | 4 (9%) | 2 (22%) |
| White | 156 (38%) | 29 (66%) | 5 (56%) |
| Census Region | |||
| Northeast | 124 (32%) | 13 (32%) | 1 (11%) |
| South | 120 (31%) | 11 (28%) | 1 (11%) |
| North Central | 81 (21%) | 8 (20%) | 3 (33%) |
| West | 64 (16%) | 8 (20%) | 4 (44%) |
| *NA = not available. †Respondents could choose more than one race. Total responses by fellowship: Adult=409, Pediatrics=44, Adult/Pediatrics=9. |
|||
2023 ASN Nephrology Fellow Survey
workforce
fellow
survey
report
Takeaways from ASN’s 10th Annual Nephrology Fellow Survey
ASN Data Subcommittee
Kurtis A. Pivert, MS ![]()
Anna M. Burgner, MD, MEHP ![]()
Raad Chowdhury, MD, FASN
Jason Cobb, MD ![]()
Susan Halbach, MD, MPH ![]()
Koyal Jain, MD, MPH, FASN ![]()
Benjamin Ko, MD ![]()
Javier A. Neyra, MD, MS, FASN ![]()
Hitesh H. Shah, MD, FASN ![]()
Stephen M. Sozio, MD, MHS, MEHP, FASN ![]()
Darcy K. Weidemann, MD, MHS ![]()
Suzanne M. Boyle, MD, MSCE ![]()
At a Glance
ASN’s Nephrology Fellow Survey measures longitudinal trends in future nephrologist demographics and post-fellowship employment. In 2023—the survey’s 10th year—47% of adult and pediatric nephrology fellows participated (450 of 954 current fellows).
An increasing number of fellows were pursuing nephrology–critical care medicine (CCM) fellowships. Nineteen respondents (5%) were in currently training in joint nephrology–CCM programs and 15 (4%) planned to enter a nephrology–intensivist fellowship next year.
Call frequency was rated the most important factor when weighing an employment offer, with both weekend call and overnight call frequency considered extremely important by more than half of respondents (55% and 54%, respectively).
Adult fellows entering practice reported a median starting base compensation of $231,000 (IQR $44,000), up 5% from 2022 (see V. Focus on the Pediatric Workforce for data on pediatric nephrologists).
A majority of fellows were entering private practice (77 respondents) but they reported the lowest median compensation ($221,000) with fellows at non-academic hospitals reporting the highest (median $282,000; 21 respondents), followed by government ($238,000; 4), and academic hospitals ($226,000; 40).
Only 5 respondents were starting practice in hospital medicine, either as an internist (3 respondents) or nephrohospitalist (2). Fellows had accepted jobs in 41 states and the District of Columbia, with 13% entering practice in rural and/or underserved states.
Nine out of 10 fellows would recommend nephrology to medical students and residents, including 96% of US medical graduates (USMGs) and 89% of IMGs. This strong endorsement came despite respondents’ substantial educational debt burden. USMGs reported median debt of $236,000 and IMGs, $60,000.
I. Inflow—The Future Workforce
Forty-seven percent of current nephrology fellows (450 of 954) responded to the 10th ASN Nephrology Fellow Survey, including 49% of adult (400 of 821) and 38% of pediatric fellows (50 of 133) training in the United States and Puerto Rico (Table 1). Overall, 250 (56%) respondents identified as men, 190 (42%) as women, and 1 (0.2%) as non-binary, with a median age of 33 years. The majority of fellow respondents were Asian or White (42% each), 13% were of Hispanic/Latina/Latino ethnicity, 9% identified as Black or African American, and 1% as American Indian/Alaskan Native.
Table 1: Respondent Demographics*
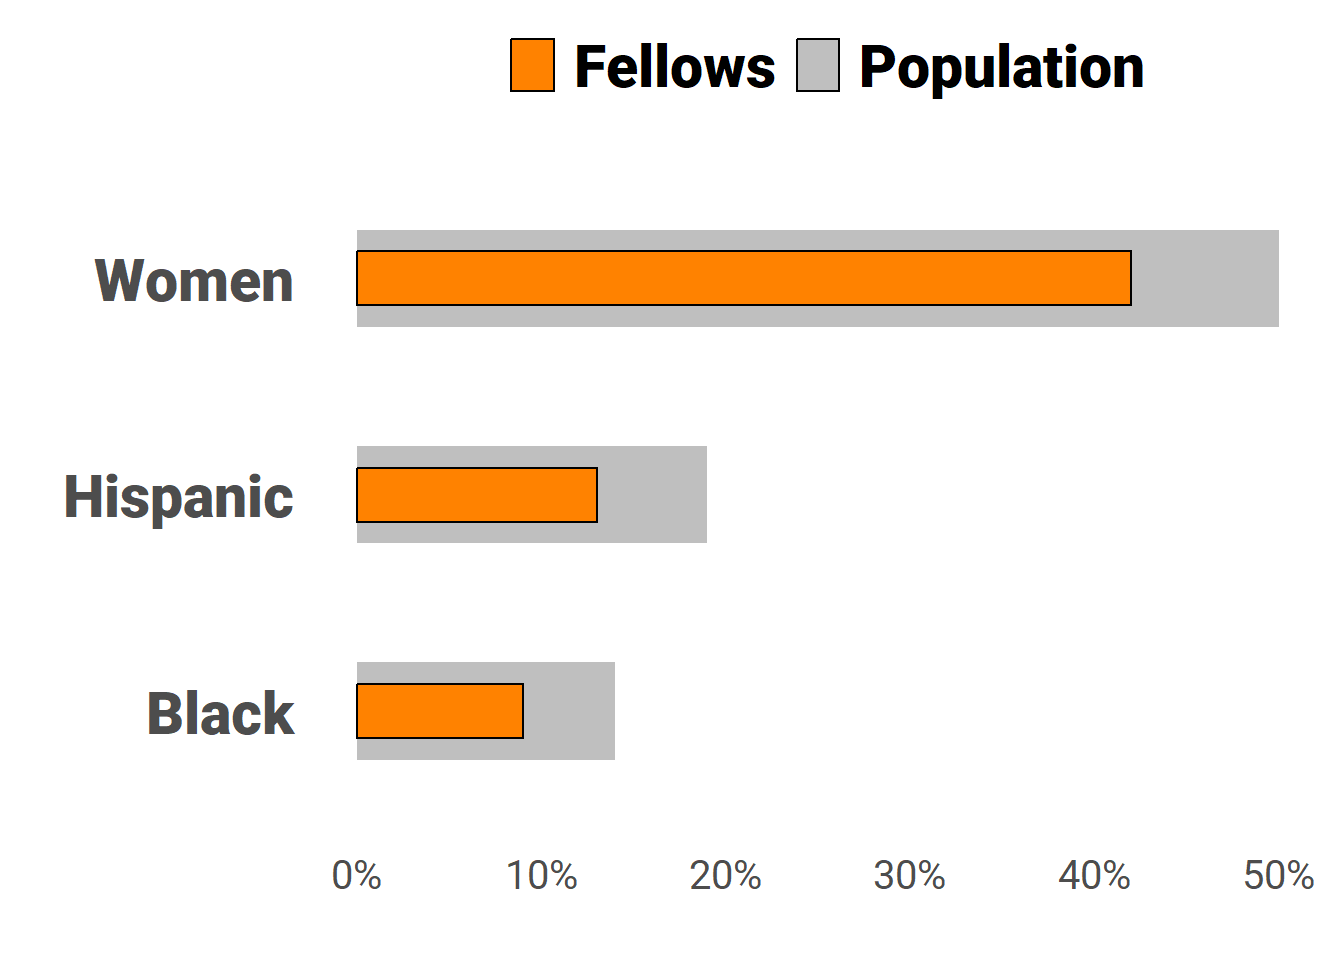
Similar to internal medicine and other medical subspecialties,(Santhosh and Babik 2020) respondent demographics did not align with the U.S. population, 50% of whom are female, 19% of Hispanic/Latina/Latino ethnicity, and 14% Black or African American race (see sidebar). The adult fellow cohort was generally representative of adult nephrology fellows overall according to the most recent Data Resource Book released by the Accreditation Council for Graduate Medical Education (ACMGE) for academic year 2021–2022 (see tables below), although White respondents were overrepresented. However, pediatric respondents demonstrated more variance in educational status, race, and ethnicity compared to ACGME data.
| Adult Fellows | ||
|---|---|---|
| Variable | ASN Survey | ACGME* |
| Mean Age (Years) | 34 | 34 |
| IMGs | 63% | 66% |
| Women | 39% | 37% |
| Asian | 44% | 46% |
| Hispanic/Latina/Latino | 12% | 10% |
| Black or African American | 10% | 7% |
| White | 38% | 28% |
| *Adult nephrology fellows reported in ACGME Data Resource Book Academic Year 2021-2022. | ||
| Pediatric Fellows | ||
|---|---|---|
| Variable | ASN Survey | ACGME* |
| Mean Age (Years) | 34 | 33 |
| IMGs | 32% | 27% |
| Women | 76% | 74% |
| Asian | 18% | 29% |
| Hispanic/Latina/Latino | 20% | 8% |
| Black or African American | 2% | 4% |
| White | 66% | 50% |
| *Pediatric nephrology fellows reported in ACGME Data Resource Book Academic Year 2021-2022. | ||
Nearly all respondents were training at an academic/university-based center (95%). Although a majority (59%) completed medical school outside the U.S., just 22% were training on a J-1 visa and 9% on H-1b visa (Figure 1). Twenty-seven participants (6%) had not completed a U.S. residency. Twelve percent were DOs, and nearly a third were training in the Northeast with 57 respondents in New York, 36 in Pennsylvania, and 22 in Massachusetts (Figure 2).
Figure 1: Respondent Citizenship Status
Figure 2: Respondents’ Fellowship Location
The vast majority of adult respondents were in clinical nephrology fellowships, but an increasing percentage were training in a joint nephrology–critical care medicine (19 fellows [4.8%]) (Figure 3). Note, transplant nephrology fellows may not have been fully represented in the survey frame due to the sampling method used.
Figure 3: Current Fellowship—Adult Fellows
The second and third years of residency continues to be the period when most fellows choose to pursue nephrology (Figure 4). However, a substantial proportion (12% overall; IMGs, 17%; USMGs, 5%) choose the subspecialty after practicing independently in another field, ranging between 12% to 16% of all adult and pediatric fellows since 2019. This represents a population of fellows with a set of experiences that are unique from brand-new internal medicine residency graduates.
Figure 4: When Fellows Chose Nephrology
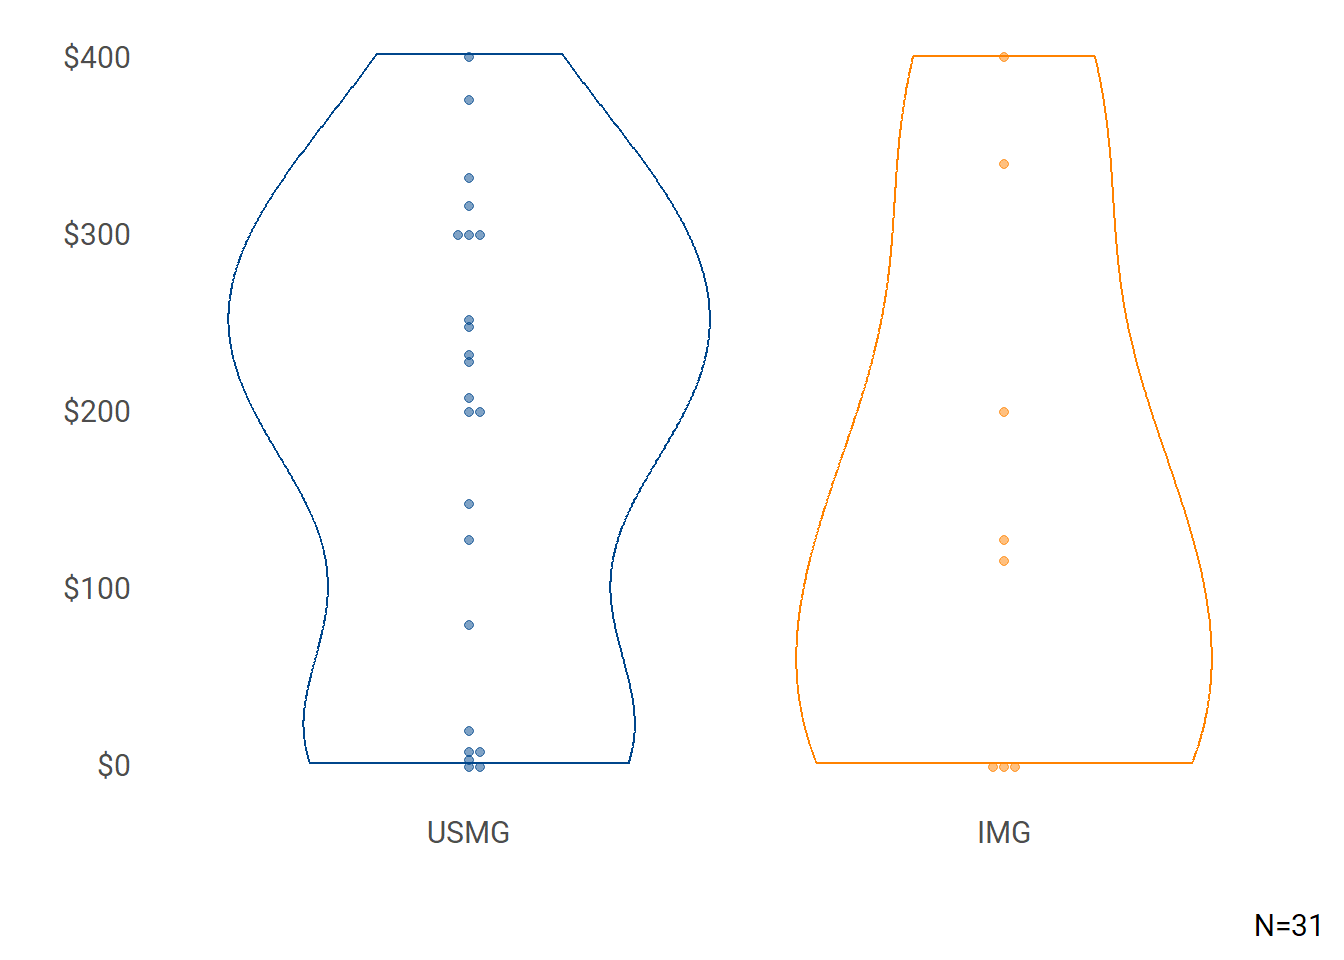
Fifty-three fellows were past Kidney STARS participants and 5, Kidney TREKS alumni (Table 2). USMGs continued to carry a substantial educational debt burden (median $236,000) compared to IMGs (median $60,000) (Figure 5).
Table 2: ASN Program Participation
| ASN Program | Description | N (%) |
|---|---|---|
| Kidney STARS | Free Kidney Week Registration & Networking Opportunities | 53 (12%) |
| Campbell Fellows | Travel Support Program for Fellows | 38 (8%) |
| Kidney TREKS | 1-week Research Course Retreat & Long-Term Mentorship Program | 5 (1%) |
| Lipps Research Fellowship | Research Fellowships Funding Fellows Conducting Original, Meritorious Research Projects | 3 (1%) |
Figure 5: Educational Debt by Medical School Location
Recommend Nephrology
This year’s survey saw the greatest percentage of fellow participants recommending nephrology—92%—including 96% of USMGs and 89% of IMGs (Figure 6).
Figure 6: Percent Respondents Recommending Nephrology
Asked why they would or would not recommend nephrology, respondents echoed similar themes from previous surveys, although this year’s nephrology–pro respondents also pointed to a robust job market while nephrology–con respondents emphasized a disconnect between effort and pay. Select representative quotes from both groups are provided below.
Perspectives—Recommend Nephrology
The challenge of the physiology, the mentorship, the close relationships with patients, the reliance on a strong internal medicine skillset and importance in a wide range of pathophysiology, the opportunities for research and discovery in the field.
I developed an interest in nephrology because of my interest in math and physics, but chose the field because my father developed kidney disease and had an amazing relationship with his nephrologist. You have the ability to really connect with your patients and develop this long-term care relationship with them. I love that you see your patients often and get to share both good times and bad times with them. Witnessing ESRD patients undergo transplantation is one of the most gratifying situations in this field.
Nephrology offers job security, a broad scope of practice, intellectual stimulation, multidisciplinary collaboration, long-term patient relationships, and research opportunities. With a high demand for nephrologists and the complexity of kidney diseases, it’s a rewarding field for medical students seeking a fulfilling career in healthcare.
Nephrology is a field with lot of future potential and diminishing supply of physicians. If a med student or resident has an interest in the specialty, I’d certainly advise pursuing it. Nephrologists practice can be very flexible depending on individual goals and one can achieve a great work life balance while still earning competitive remuneration.
I will say there is a little bit of hesitation in the recommendation because I think burnout in this field is a huge issue, but I love the field because it’s interesting medicine, and you are involved in every aspect of patient care.
Perspectives—Would Not Recommend Nephrology
Although I love Nephrology and I do think I made the right choice, overall Nephrology is underappreciated, undercompensated and overworked as a field and overall I do not recommend it for most students unless there is a very strong and unique interest in the kidney physiology and patients with renal disease.
The compensation is not adequate for the amount of work we are doing. Night calls and week-end calls make it less appealing as well.
Pediatric nephrologists are grossly underpaid, it is an emotionally challenging field and it seems that because the workforce is scarce, our workload will increase in the coming years.
The future reimbursement will continue to be poor, we are giving away intervention and dialysis to others, it is just a matter of time when we will have given away our unique skills.
Lifestyle is difficult and reimbursement is low when you account for the effort required. Medicare reimbursements also continued to be cut which makes it difficult to care for those who need it and still be financially viable. As interesting as the field can be, it’s difficult for most to sacrifice both income and quality of life. Many can give up one or the other but not both.
II. Future Plans
Note
This Section Reports ADULT Fellow Responses Only
Among respondents who were completing training, twice as many were planning to enter private practice (27%) than academic practice (12%) (Figure 7). Twelve fellows were entering internal medicine residency, most likely after having already completed residency in their home countries before fellowship. Of the 45 respondents pursuing additional training, planned fellowships included transplant (18 fellows), nephrology-CCM (15), glomerulonephritis (4), interventional nephrology (3), research (2), and home dialysis and hypertension (1 fellow each).
Figure 7: Plans Upon Completion of 2022–2023 Training Year
Job Market Perspectives
A majority of USMG and IMG fellows saw an appropriate number of both local (within 50 miles of their training site) and national employment opportunities, but their perspectives continue to diverge by locale. More USMGs (59%) saw an appropriate number of jobs locally than IMGs (45%), with a third of IMGs (34%) saying there were too few/far too few local jobs (Figure 8). Nationally, the perspectives flipped with 54% of IMGs perceiving appropriate national opportunities, compared with 49% of USMGs (Figure 9).
Figure 8: Local Job Market Assessments
Figure 9: National Job Market Assessments
Important Job Factors
Among the 398 adult fellows who responded to the question measuring the importance of certain aspects of potential job offers:
Frequency of weekend call and overnight call were rated “Extremely Important” by half of the respondents (55% and 54%, respectively; Figure 10).
Both weekend call frequency (USMG: 69 respondents [1st]; IMG: 141 respondents [1st]) and overnight call frequency (USMG: 66 [3rd]; IMG: 135 [2nd]) were among the top three factors rated “Extremely Important” for both USMGs and IMGs. For USMGs, a job in a desired location was the remaining top-rated factor (68 respondents, [2nd]), while for IMGs vacation time rounded out the top three (109 respondents [3rd]). Jobs that met visa requirements were the 5th-highest factor rated extremely important for IMG respondents.
Top three factors rated “Extremely Important” by both women and men were the exact same—weekend call frequency, overnight call frequency, and a job in a desired location.
Figure 10: Important Factors When Evaluating Job Opportunities
III. Fellow Job Search Experiences
Note
This Section Reports ADULT Fellow Responses Only
| Positions Sought | |
|---|---|
| Job Type | N |
| Clinical Nephrology | 143 |
| Medical Education | 22 |
| Hospitalist—Nephrology | 13 |
| Nephrology—Research | 8 |
| Hospitalist | 4 |
| Clinical Nephrology combined with Non-nephrology Specialty | 2 |
| Non-nephrology—Other Clinical Specialty | 2 |
| Industry | 1 |
Sixty-seven percent of adult trainees who had completed ≥2 years of accredited training (150 of 224 respondents) had initiated or completed their search for post-fellowship employment at the time of survey. Clinical nephrology positions were the most commonly sought (143 respondents) with medical education a distant second (22 respondents; see sidebar).
Job searchers applied for a median 4 positions (USMG, median 3.5; IMG, 5), and received a median 3 offers of employment (USMG, median 3; IMG, 4). Female and male respondents reported similar numbers of applications (median 4) and job offers (median 3). Eighty-four percent of graduating adult respondents (140 fellows, see IV. Entering Practice) had accepted a position, 8% (14) had not been offered a job, and 8% (13 fellows) had received a job offer but were still searching for another position.
Similar to 2022, 29% of job seekers experienced difficulty in finding a position they considered satisfactory—37% of IMGs (33 fellows) and 17% of USMGs (10 fellows). Inadequate compensation and inability to find positions in a desired location and practice setting were again the top-cited reasons for the difficulty for both IMG and USMG respondents (Table 3).
Table 3: Reasons Cited for Difficulty in Finding a Satisfactory Nephrology Position*
| Unable to Find a Job: | IMG (N=33) | USMG (N=10) |
|---|---|---|
| Offering adequate salary/compensation | 23 (70%) | 6 (60%) |
| In a desired location | 21 (64%) | 7 (70%) |
| In a desired practice setting (e.g., hospital, group practice) | 14 (42%) | 5 (50%) |
| That met visa status requirements | 13 (39%) | 1 (10%) |
| Offering employment opportunities for spouse/partner | 2 (6%) | 0 (0%) |
| Other (Please specify) | 2 (6%) | 1 (10%) |
| *N=43 | ||
IV. Entering Practice
Note
This Section Reports ADULT Fellow Responses Only
| First Job–Responsibilities* | |
|---|---|
| Responsibilities | N (%) |
| Outpatient—CKD | 142 (95%) |
| Outpatient—In-center HD | 134 (89%) |
| CRRT | 124 (83%) |
| PD | 121 (81%) |
| Home HD | 98 (65%) |
| Outpatient—Other | 83 (55%) |
| Education | 62 (41%) |
| Dialysis Medical Director | 47 (31%) |
| Apheresis | 36 (24%) |
| Outpatient—Transplant | 35 (23%) |
| Joint Venture—Dialysis | 28 (19%) |
| POCUS | 25 (17%) |
| Clinical research | 23 (15%) |
| Kidney biopsy | 18 (12%) |
| Dialysis catheter placement | 12 (8%) |
| Interventional nephrology | 5 (3%) |
| Other | 2 (1%) |
| Basic science research | 0 (0%) |
| Translational research | 0 (0%) |
| *N=150 | |
Of 139 adult respondents entering practice (and the 13 fellows who received an offer but remained uncommitted at survey time) California (8 fellows), Texas (8), and Florida (7) were top destinations (Figure 11). However, this year fellows were also starting positions in rural or underserved states, including Montana (1 fellow) and Wyoming (1), with 11% practicing in a small city and 6% in a rural area. Yet most first post-fellowship positions were still situated in large cities (65%) or suburban locations (11%). Ninety-two percent (141 respondents) were focused on clinical nephrology (Figure 12), with only 5 fellows practicing hospital medicine either as an internist (3) or dedicated nephro-hospitalist (2). Half of the respondents entering the workforce (80 fellows) were starting in private practice and 30% (44) in an academic hospital system (Figure 13). Outpatient CKD clinic (95%), and dialysis modalities were the most common responsibilities anticipated by fellows in their first post-graduation position (see sidebar table First Post-Fellowship Position—Responsibilities). Procedures (kidney biopsy, 12%; dialysis catheter placement, 8%) and overall interventional nephrology (3%) were the least-reported anticipated responsibilities.
Figure 11: First Post-Fellowship Position—State
Figure 12: First Position Focus
Figure 13: First Position Employer
Compensation and Incentives
Median base starting salary rose 5% to $231,000 in 2023. Differences in starting compensation by gender were similar to 2022 (women, median $229,000; men, $230,500; Figure 14) but variation by medical school location narrowed over last year (IMGs, median $240,000; USMGs, $225,000; Figure 15). Excluding 3 fellows working in other employment settings, fellows working for non-academic hospitals reported the highest median starting base salary ($282,000, IQR $72,000; 21 respondents) followed by those in government (median $238,000, IQR $12,500; 4), academic hospitals ($230,000, IQR $39,000; 41), and private practice ($222,000, IQR $47,000; 79 respondents) (Figure 16). Although the survey frame was designed to be representative of all fellows in training, it is possible that those who responded differed substantively.
Figure 14: Base Salary—Gender
Figure 15: Base Salary—Medical School
Figure 16: Base Salary by Employer
Most starting positions were at 1 full-time equivalent (FTE; 83%, 113 fellows), with 5 respondents (4%) at 0.9 FTE. Beyond base compensation, nearly all respondents with an employment offer (149 fellows) received at least one incentive (detailed in Table 4), with malpractice insurance (64%), income guarantees (55%), support for MOC/CME (52%), and a sign-on bonus (42%) most commonly reported. Seventeen-percent of IMG respondents (25 fellows) received a J-1 visa waiver and another 17% (25) H-1 visa sponsorship. Of note, this year 19% of respondents anticipated receiving quality-metric bonuses. Fifty-percent of respondents who received incentives indicated they were “Extremely/Very Important” in choosing to accept a job (Figure 17). Unlike base salary, gender differences in incentive pay were marked with men reporting a median $22,500 versus median $10,000 for women (Figure 18) but less so for medical school location (IMG, median $19,500; USMG, $20,000; Figure 19).
Table 4: Incentives Received*
| Incentive | N (%) |
|---|---|
| Malpractice Insurance | 95 (64%) |
| Income guarantees | 82 (55%) |
| Support for maintenance of certification and continuing medical education | 78 (52%) |
| Sign-on bonus | 62 (42%) |
| Relocation allowances | 62 (42%) |
| Career development opportunities | 48 (32%) |
| Flexible schedule | 33 (22%) |
| Quality-Metric Bonus Payments | 28 (19%) |
| H-1 visa sponsorship | 25 (17%) |
| J-1 visa waiver | 25 (17%) |
| On Call/Moonlighting Payments | 14 (9%) |
| On-call payments | 13 (9%) |
| Educational loan repayment | 11 (7%) |
| Protected time for research/research “start-up” package | 10 (7%) |
| Real estate venture | 7 (5%) |
| Spouse/partner job transition assistance | 7 (5%) |
| Other (Please specify) | 7 (5%) |
| *N=149 | |
Figure 17: Importance of Incentives
Figure 18: Incentive Pay—Gender
Figure 19: Incentive Pay—Medical School
V. Focus on the Pediatric Workforce
Note
This Section Reports PEDIATRIC Fellow Responses Only, Including Adult/Pediatric Fellows
Demographics
As noted in Table 1, 41 pediatric and 9 adult/pediatric nephrology fellows responded in 2023 (38% response), with the majority of fellows USMGs (72%), women (70%), U.S. citizens (72%), White (68%), and non-Hispanic/Latina/Latino (80%). Educational debt levels were similar to those for adult nephrology fellows—median $200,000 for pediatric fellows and $198,000 for adult/pediatric fellows. Debt based on medical school location was also similar to adult fellows, with median debt for USMGs $205,000 and IMGs $120,000 (Figure 20).
Given the substantial debt levels reported by pediatric respondents, 16 fellows (32%) planned to apply for loan mitigation at either the Public Service Loan Forgiveness Program, ASN Loan Mitigation Program, or NIH Loan Repayment Program, and two fellows had already received loan mitigation (two fellows were not aware of loan mitigation programs).
Figure 20: Educational Debt—Pediatric Respondents
Future Plans
Most pediatric respondents were continuing their fellowship (64%) and 26% were entering academic practice. One fellow was entering a general pediatrics residency to qualify for board certification (Figure 21).
Figure 21: Plans Upon Completion of 2022–2023 Training Year
Pediatric fellows were specifically queried about plans to pursue part-time employment in their first post-fellowship position. Only 14% of respondents (7 fellows) were planning to look for part-time positions after fellowship, with most (66%, 33 fellows) not considering it and 20% undecided (10 fellows). Of the top reasons to prefer part-time employment, improved work-life balance was the most common (38.5% of respondents) followed by anticipated unmanageable workload (30.8%), whereas work-life balance (40%) and serving as a family caregiver (35%) were the top reasons to consider it (see tables below).
| Reasons to PREFER Part-Time | N | Percent |
|---|---|---|
| Improve Work-Life Balance | 5 | 38.5% |
| Anticipated Unmanageable Workload | 4 | 30.8% |
| To Serve as a Family Caregiver | 3 | 23.1% |
| To Focus on Another Opportunity | 1 | 7.7% |
| Reasons to CONSIDER Part-Time | N | Percent |
|---|---|---|
| Improve Work-Life Balance | 8 | 40% |
| To Serve as a Family Caregiver | 7 | 35% |
| Personal Health Issue | 2 | 10% |
| Anticipated Unmanageable Workload | 1 | 5% |
| Emotional Stress | 1 | 5% |
| To Focus on Another Opportunity | 1 | 5% |
Pediatric Nephrology Job Market Perspectives
Although the majority of USMG and IMG fellows perceived an appropriate number of local (Figure 22) and national (Figure 23) job opportunities, there was more pessimistic local assessments (31% of USMGs and 43% of IMGs thought there were too few/far too few local opportunities) and varied opinions about both markets.
Figure 22: Local Pediatric Nephrology Job Market Assessments
Figure 23: National Pediatric Nephrology Job Market Assessments
Pediatric Job Search Experiences
| Positions Sought | |
|---|---|
| Job Type | N |
| Pediatric Nephrology | 14 |
| Research | 3 |
| Industry | 2 |
| Clinical Neph & Other Specialty | 1 |
| General Pediatrics | 1 |
Fifteen pediatric fellows had started the job search process and most were looking for clinical nephrology positions (14) (see sidebar). Twelve respondents had accepted an offer, 2 had not been offered a job at survey time, and 1 had received an offer but were still looking. Three had experienced difficulty finding a position they considered satisfactory, primarily due to a lack of positions with adequate salary, and in a desired location and practice setting. Pediatric respondents had submitted a median 4 job applications and received 2 job offers overall, with men applying for more jobs (4.5 vs median 3 for women) and receiving more offers (median 3 vs median 2 for women).
| First Post-Fellowship Position Responsibilities* | |
|---|---|
| Responsibilities | N (%) |
| Outpatient clinic—CKD | 12 (92%) |
| Outpatient clinic—Other Specialty (e.g., GN, stones, hypertension) | 12 (92%) |
| PD | 11 (85%) |
| CRRT | 11 (85%) |
| Outpatient In-Center Hemodialysis | 10 (77%) |
| Education | 10 (77%) |
| Kidney biopsy | 9 (69%) |
| Outpatient clinic—Transplant | 7 (54%) |
| Apheresis | 7 (54%) |
| Clinical research | 7 (54%) |
| Home HD | 2 (15%) |
| POCUS | 2 (15%) |
| Dialysis catheter placement | 1 (8%) |
| Translational research | 1 (8%) |
| *N=13 | |
Entering Pediatric Nephrology Practice
All 13 pediatric nephrology fellows were focused on clinical practice in their first post-fellowship job. Outpatient clinics in CKD and other specialties along with dialysis modalities were the top anticipated responsibilities in respondents’ first position (see sidebar).
Texas (3 respondents) and California (2 respondents) were the top states for pediatric respondents first position, with Colorado, Florida, Hawaii, Massachusetts, Michigan, New York, and Pennsylvania reported by 1 each. Most starting pediatric nephrologists were entering practice in large cities (85%, 11 fellow respondents), with 1 each in a small city and suburban area. This was unsurprising since most (83%, 10 respondents) were joining academic/university-based health systems, with the remaining two respondents (17%) at non-academic health systems.
Median starting salary was $171,000 (IQR $45,000) (due to the small number of responses, aggregates based on fellow sex and medical school location are not provided; Figure 24). Maintenance of certification/continuing medical education support and malpractice insurance were the most common employment incentives (Table 5), yet unlike for adult fellows, they had little bearing on pediatric fellows’ choice to accept a job offer (Figure 25).
Figure 24: Base Salary
Table 5: Incentives Received*
| Incentive | N (%) |
|---|---|
| Support for maintenance of certification and continuing medical education | 10 (77%) |
| Malpractice Insurance | 8 (62%) |
| Sign-on bonus | 6 (46%) |
| Career development opportunities | 6 (46%) |
| Income guarantees | 3 (23%) |
| Relocation allowances | 3 (23%) |
| Flexible schedule | 3 (23%) |
| Quality-Metric Bonus Payments | 3 (23%) |
| On Call/Moonlighting Payments | 2 (15%) |
| H-1 visa sponsorship | 1 (8%) |
| Real estate venture | 1 (8%) |
| On-call payments | 1 (8%) |
| Spouse/partner job transition assistance | 1 (8%) |
| Protected time for research/research “start-up” package | 1 (8%) |
| Other (Please specify) | 1 (8%) |
| *N=13 | |
Figure 25: Importance of Incentives
Methods
Who were surveyed?
The 2023 ASN Nephrology Fellow Survey was distributed to a survey frame of 954 adult, pediatric, and adult/pediatric nephrology fellows drawn from the ASN (821 adult fellows) and American Society for Pediatric Nephrology (133 fellows) member databases. The survey received a 47% response rate, with participation from 400 adult, 41 pediatric, and 9 adult/pediatric fellows in training.
How was the survey constructed?
The survey instrument comprised:
- Longitudinal questions drawn from the original 2014 survey focusing on job search experiences, perceptions of the specialty, practice patterns, and demographics
- Questions developed by the ASN Data Subcommittee to assess adult nephrology fellows’ experiences and preferences about current required procedural competencies for board certification, including number performed and self-assessed competence.
The final instrument was piloted by ASN Data Subcommittee members and distributed via Qualtrics.
When was the survey conducted?
Invitation emails were sent to adult fellows on May 13 and the survey closed on May 23, 2023. Participating fellows were eligible to win one of 10 complimentary one-year ASN memberships or one of two complimentary BRCU registrations.
How were responses analyzed?
The ASN Nephrology Fellow Survey was reviewed and approved by the Johns Hopkins University School of Medicine Institutional Research Board (Study # 00205206). Data obtained from 2023 responses were analyzed using R (R Core Team [2021]. R: A language and environment for statistical computing. R Foundation for Statistical Computing, Vienna, Austria.).
Why does ASN survey nephrology fellows in training?
Since 2014, ASN has conducted an annual fellow survey to understand:
- The composition of the incoming workforce, including race, ethnicity, and gender
- Motivating factors for choosing the specialty to tailor approaches to sustain interest in nephrology
- Potential gaps in nephrology education
- Demand for nephrologists in the U.S.
References
Santhosh, Lekshmi, and Jennifer M. Babik. 2020. “Trends in Racial and Ethnic Diversity in Internal Medicine Subspecialty Fellowships From 2006 to 2018.” JAMA Network Open 3 (2): e1920482. https://doi.org/10.1001/jamanetworkopen.2019.20482.
Citation
BibTeX citation:
@online{a._pivert2023,
  author = {A. Pivert, Kurtis and M. Burgner, Anna and Chowdhury, Raad
    and Cobb, Jason and Halbach, Susan and Jain, Koyal and Ko, Benjamin
    and A. Neyra, Javier and H. Shah, Hitesh and M. Sozio, Stephen and
    K. Weidemann, Darcy and M. Boyle, Suzanne},
  title = {2023 {ASN} {Nephrology} {Fellow} {Survey}},
  date = {2023-09-27},
  url = {https://data.asn-online.org/posts/2023_fellow_survey/},
  doi = {10.70093/h78950247},
  langid = {en}
}
For attribution, please cite this work as:
A. Pivert, Kurtis, Anna M. Burgner, Raad Chowdhury, Jason Cobb, Susan
Halbach, Koyal Jain, Benjamin Ko, et al. 2023. “2023 ASN
Nephrology Fellow Survey.” September 27, 2023. https://doi.org/10.70093/h78950247.