| Clinical Service Area | % of Nephrology Visits |
|---|---|
| Blood | 3.5% |
| Circulatory | 48.0% |
| Congenital Anomalies | 0.3% |
| Digestive | 0.1% |
| Endocrine/Immunity | 5.6% |
| Genitourinary | 38.7% |
| Infectious | 0.1% |
| Injury | 0.2% |
| Mental | 0.0% |
| Musculoskeletal | 0.2% |
| Neoplasms | 0.5% |
| Nervous System | 0.1% |
| Perinatal | 0.0% |
| Pregnancy/Childbirth | 0.0% |
| Preventative care | 0.2% |
| Residual Codes | 2.0% |
| Respiratory | 0.1% |
| Skin | 0.1% |
| Symptoms & Signs | 0.3% |
Nephrologist Workforce Trends in the United States
workforce
report
UNC Sheps Analysis Finds Nephrology Workforce Maldistributed with Some Markets Saturated and Others Facing Shortages
This report was produced by the Program on Health Workforce Research at the Cecil G. Sheps Center for Health Services Research at UNC Chapel Hill, in collaboration with Strategic Modelling Analysis & Planning (SMAP) with funding from the American Society of Nephrology.
Introduction
The American Society of Nephrology (ASN) and the George Washington University (GWU) have produced numerous reports on the nephrology workforce in the United States (US). These reports describe the current supply, distribution, training, career pathways, and demand for nephrologists in the US. To investigate future trends in nephrology supply and demand, the Cecil G. Sheps Center for Health Services Research (Sheps Center) at UNC Chapel Hill compared findings from the Review of the US Nephrology Workforce 2015 Report1 (hereafter “ASN Report”) and the FutureDocs Forecasting Tool2, a physician projection model (hereafter “UNC model”) developed by the Sheps Center. This document reports on that analysis and is broken into two sections:
Section 1 compares data from the ASN report to data from the UNC model. The purpose of this comparison is to identify areas where the data converge/diverge and where findings from the UNC model may provide additional information on the nephrology workforce.
Section 2 provides nephrologist supply projections from the UNC model and outlines the underlying data and assumptions made about the nephrologist pipeline, full-time equivalents by age and gender, and retirement probabilities.
Section 1. Comparison of ASN Report and UNC Model
1.1 Distribution of Nephrologists
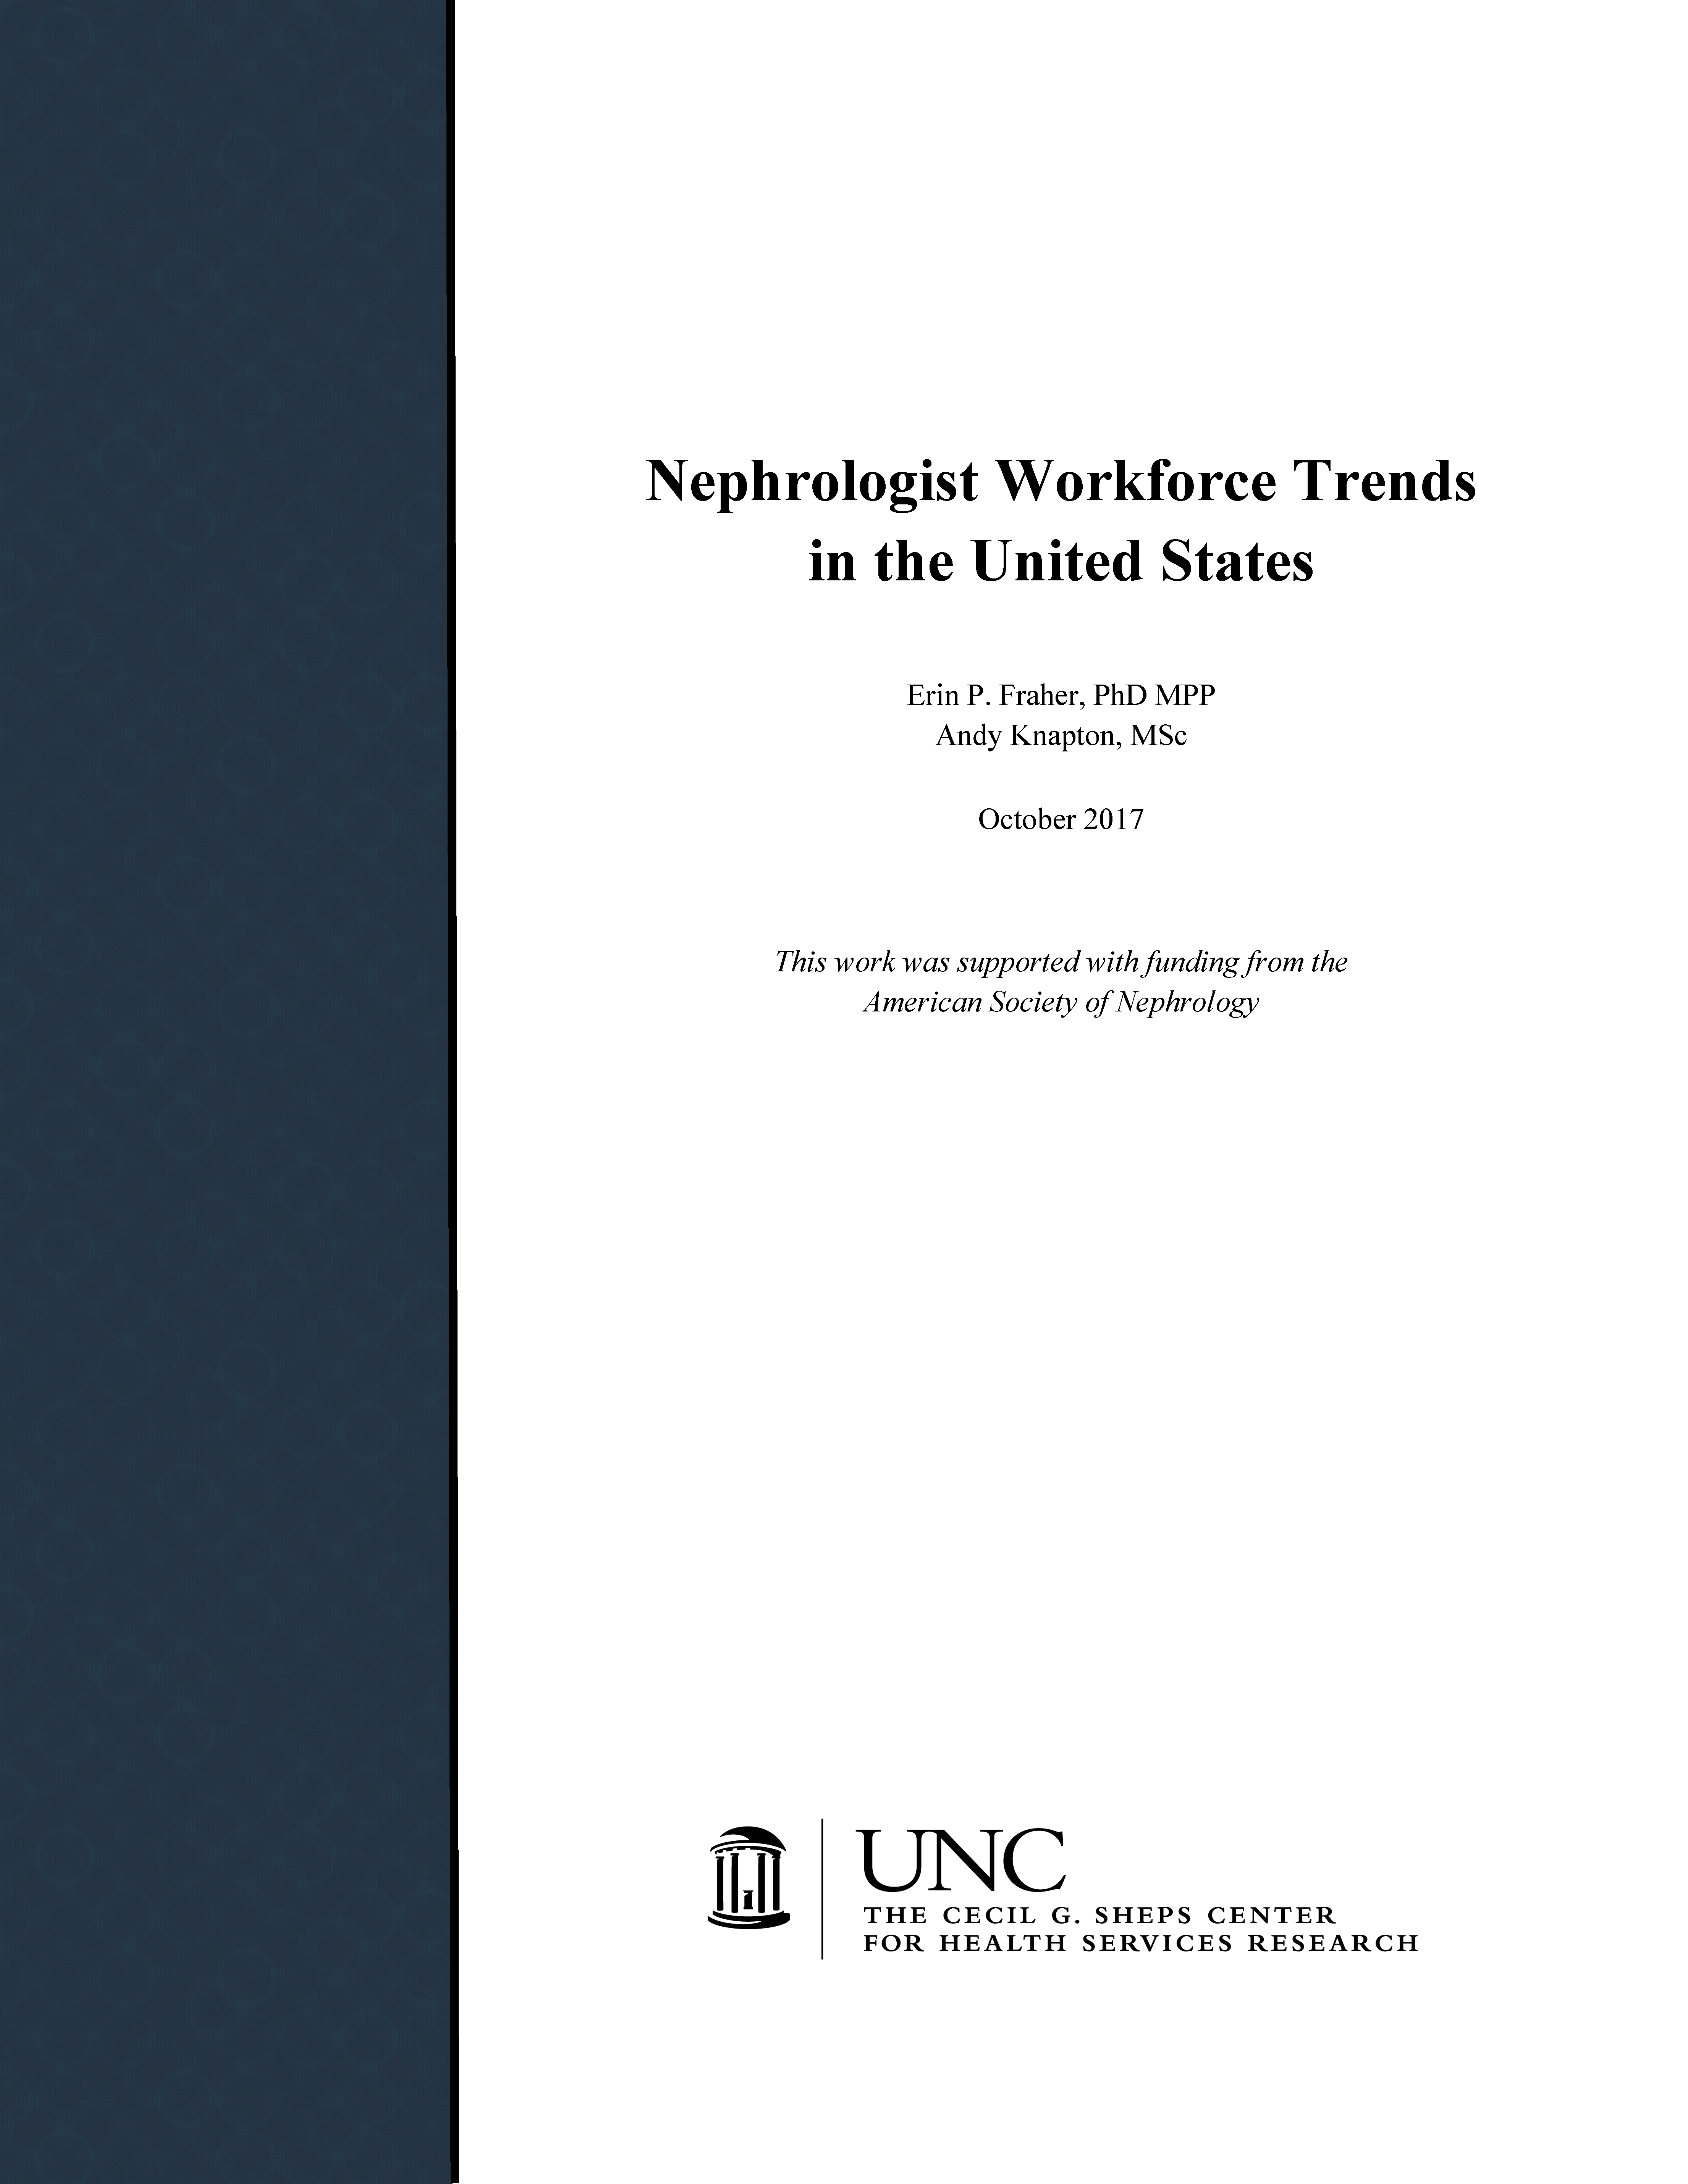
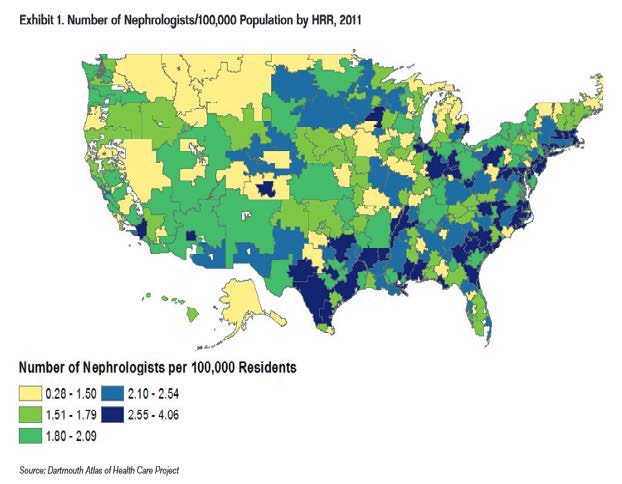
Figure 1 shows the current distribution of nephrologists from the ASN Report and the UNC model. The ASN model shows headcount per 100K in 2011 and the UNC model shows FTE per 10K in 2013. The two models also use slightly different geographic boundaries. ASN uses Hospital Referral Regions (HRRs), based on ZIP code areas, and the UNC model uses Tertiary Service Areas (TSAs) based on counties3. Despite these differences, the geographic distributions look similar, with a larger supply of nephrologists in the southeast and lower supply in central northern regions. Throughout the country, there are “pockets” of underserved regions that adjoin areas of greater supply.
1.2 Demand for Nephrologists
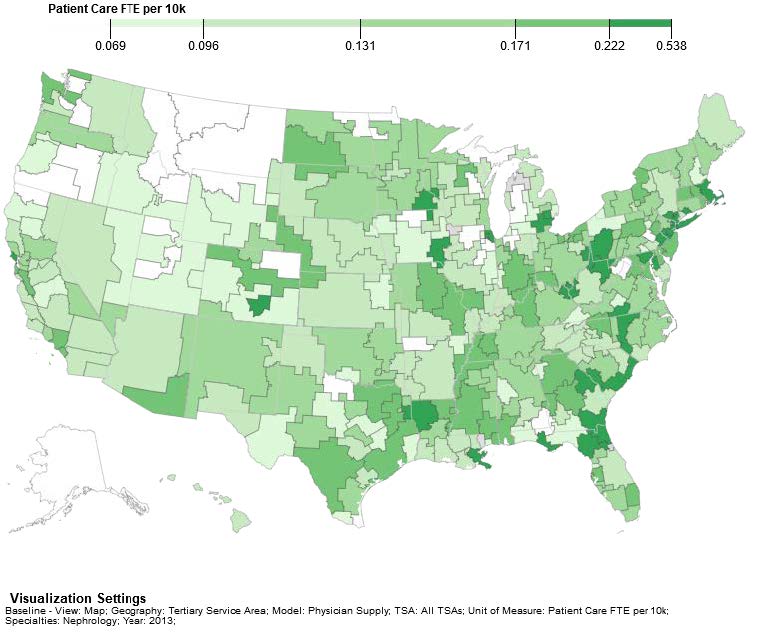
The ASN Report uses End Stage Renal Disease (ESRD) patients as a proxy for demand. The report recognizes that this is an approximation by saying, “Although nephrologists provide many services to patients with kidney diseases and injury beyond ESRD care, this analysis uses Medicare ESRD patients as the measure of need for nephrology services.” It also notes, “Chronic Kidney Disease, CKD, although of greater prevalence than ESRD, does not place the same demands on nephrologists’ time.”
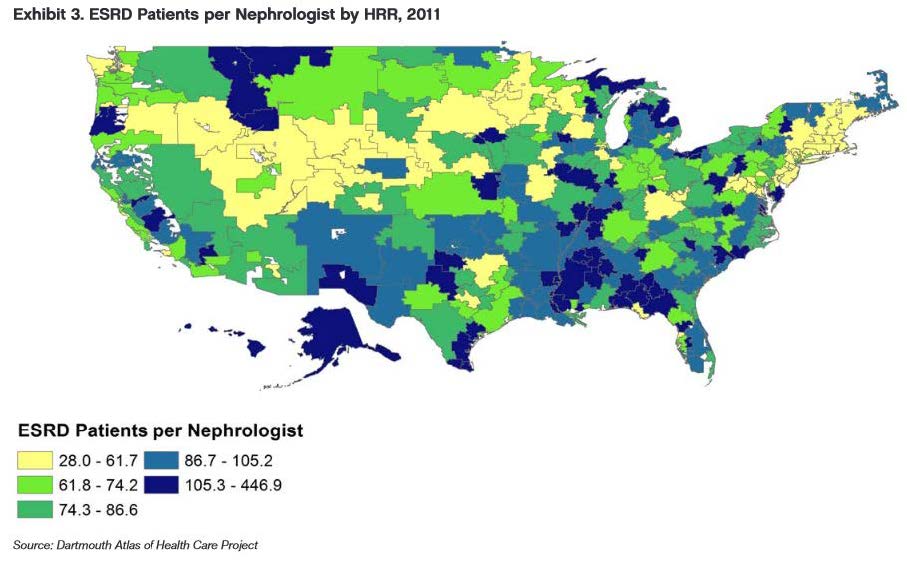
Figure 2 shows the ASN report’s map of ESRD patients by HRR.
The UNC model measures demand for nephrologists based on data derived from the Medical Expenditure Panel Survey (MEPS). MEPS visits are classified into 19 Clinical Service Areas (CSAs4) based on the Agency for Healthcare Research and Quality’s (AHRQ) Clinical Classification Software which serves as a way to categorize diagnosis codes. Table 1 shows, from MEPS data, how nephrologists’ visits are distributed across the 19 different CSAs. Over 86% of nephrology visits are within the circulatory and genitourinary CSAs, 5.6% are in endocrinology, and the rest are spread across other visit types.
Table 1. Distribution of Patient Visits Seen by Nephrologists Across Clinical Service Areas
The full list of conditions in the circulatory and genitourinary CSAs is listed in Appendix 1.
Demand for genitourinary and circulatory visits in the UNC model is forecast out to 2030 for each county in the United States, based on population growth and factors known to influence healthcare use: sociodemographics (age, gender, race/ethnicity); socioeconomics (family income below federal poverty guidelines); markers of health risk and status (current smoker, obesity, and having been diagnosed with diabetes); and an indicator for whether the respondent is uninsured. The county forecasts are aggregated to the TSA level.
Figure 3a shows the distribution of demand for circulatory visits per 10k population in 2013 and Figure 3b shows the distribution of demand for genitourinary visits per 10k population in 2013.
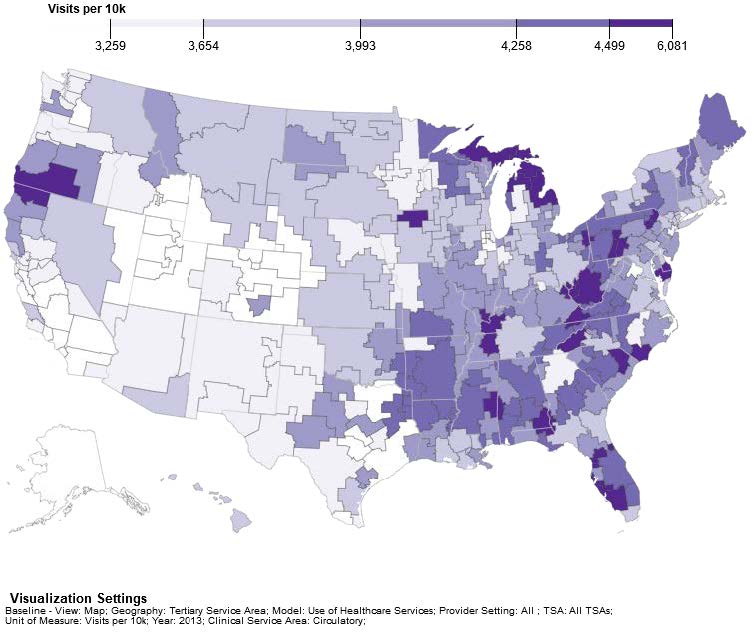
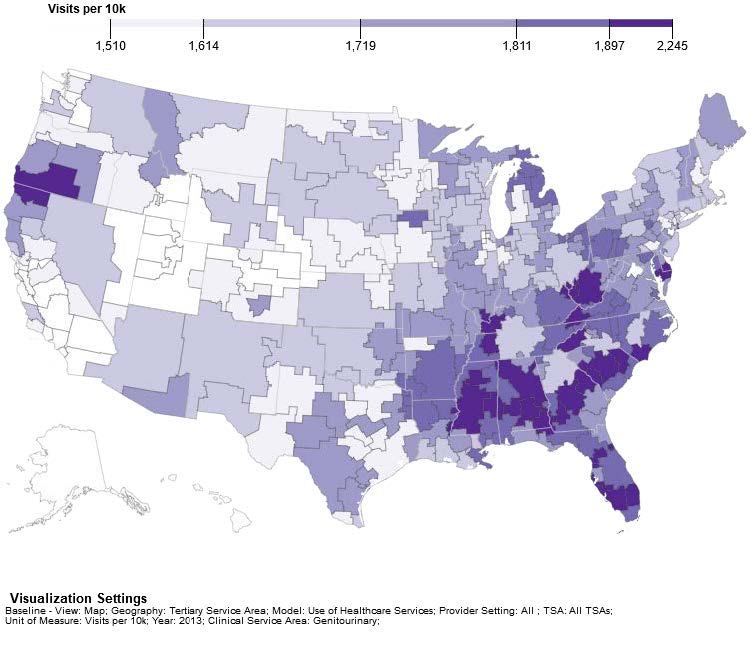
Due to different approaches to modeling demand, the ASN and UNC models are likely to show different patterns. However, both models show similar distributions of a higher level of demand in the southeastern states.
1.3 Assessing surplus and shortage of nephrologists
The two models also use different measures of quantifying surplus and shortage. The ASN report uses the approach of case load per nephrologist as shown in Figure 4. Higher caseload per nephrologist is used as a proxy indicator of potential excess demand (blue areas in the map).
The UNC model measures shortage or surplus by assessing the difference between the number of visits that physicians in a given geographic area can supply compared to the demand for visits in that geographic area. This match between supply and demand is assessed for each of the 19 CSAs in three settings—inpatient, outpatient and emergency settings. For the purposes of comparing the UNC and ASN models, the inpatient setting is used to compare the ASN and UNC models. The nephrology workforce, as shown in Table 1, mainly works in the genitourinary and circulatory clinical service areas. Therefore, if an area has a surplus of visits in genitourinary and circulatory CSA, it would suggest that there is a potential surplus of providers undertaking genitourinary or circulatory activity in that area. Conversely, if an area has unmet visits it would suggest a potential shortage of nephrologists and other physicians who see circulatory and genitourinary patients.
Figure 5a shows the UNC model’s visualization of surplus and shortage for inpatient circulatory visits and Figure 5b shows the visualization of surplus and shortage for inpatient genitourinary visits per 10k population in 2013. Those areas shaded in light tan have the greatest excess demand for visits and those areas in darker shades have the greatest surplus of providers available to meet demand.
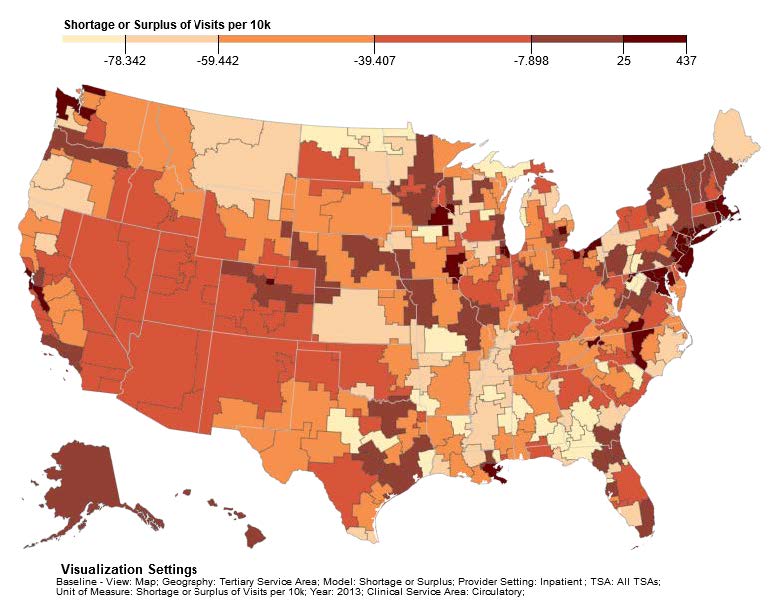
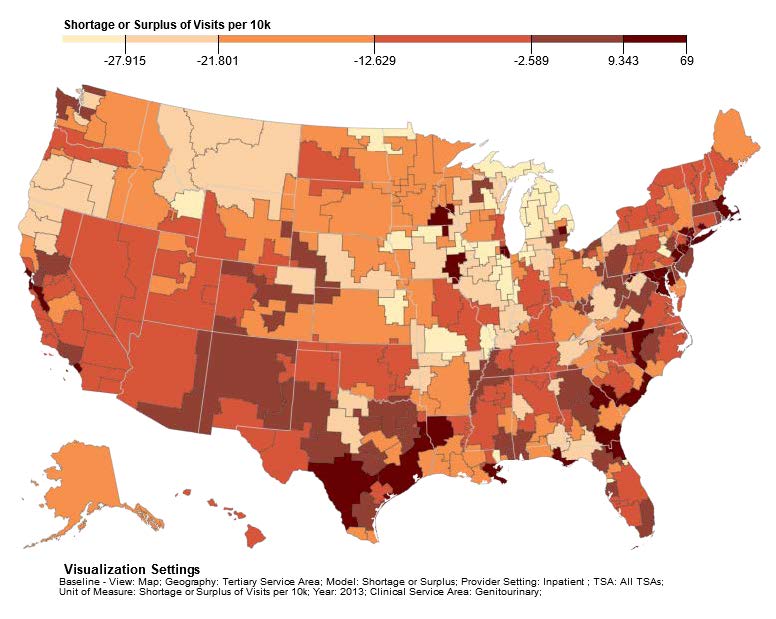
Figures 5 show, for example, that the TSAs of Great Falls and Billings in Montana have some of the greatest shortages of physicians providing visits in both circulatory and genitourinary services. This compares well with the high nephrology case load for the same areas shown in Figure 4. In general, there is not a close match between the shortage estimates contained in Figures 4 and 5 but variation would be expected due to differences in modeling supply and demand between the two models.
The ASN report also uses a measure of demand based on the job market for residents entering the workforce. Based on responses from 132 second year nephrology residents seeking employment, there were indications of increased difficulty in finding a “satisfactory” job, which might indicate a potential oversupply. However, the ASN report says that none of the three major dialysis organizations that hire nephrologists anticipated a decrease in demand. This implies a mismatch between expectations of residents and job availability. The report suggests that the job market is segmented into three tiers:
Tier 1: Large metropolitan (e.g., New York City, Chicago, Miami) – which is saturated and therefore has few job opportunities
Tier 2: Smaller metropolitan areas (e.g., Boise ID, Charleston SC) – which is 80% saturated
Tier 3: Rural markets, which are wide open.
Table 2 shows that data from the ASN survey align well with the UNC model. Both analyses find that large metropolitan areas have an adequate or even oversupply of providers but rural areas face shortages.
Table 2: Comparison of Job Market for Nephrologists in ASN and UNC Analyses
| Tiers in ASN report | Description of Market | UNC Model’s Rank of Shortage/ Surplus for Circulatory/ Genitourinary* |
| 1: Large metropolitan (e.g., New York City, Chicago, Miami) |
Market saturated, therefore has few job opportunities | New York 8th and 4th Chicago (Melrose Park) 2nd and 10th Miami 46th and 37th |
| 2: Smaller metropolitan areas (e.g., Boise ID, Charleston SC) | 80% saturated | Boise ID 127th and 162nd Charleston SC 78th and 24th |
| 3. Rural markets, which are wide open | Market is wide open | Traverse City MI 228th and 294th Slidell LA 294th and 290th |
*The UNC model ranks the degree of a surplus or shortage of providers for circulatory and genitourinary conditions in each of the 294 TSAs. 1=a ranking of greatest surplus. 294=ranking of greatest shortage. A ranking greater than 58 in circulatory and greater than 56 for genitourinary indicates a shortage of providers.
Figure 6 compares the difference between the residency numbers reported in the ASN report and those recorded in the AAMC GME Track survey. The data show that, on average, the number of residents in the ASN report is about 94% of the number of residents recorded in GME Track. The source for the ASN residency numbers is the annual ACGME data resource book. The difference between the two data sources is probably due to the ACGME only counting nephrology residents in PGY4 & PGY5. GME Track records nephrology residents who, for a number of reasons, are at PGY6 and beyond. Neither GME Track nor the ACGME data include residents in AOA approved programs.

GME Track data in Figure 6 show a decrease in residents after 2013. This is consistent with Figure 7 which shows ACGME data on the decreasing number of nephrology positions between 2014-15.

Section 2. UNC model data and assumptions
2.1 Summary of the UNC Supply Model
The UNC model estimates physician supply by specialty, state, tertiary service area (TSA), and year. Physician supply is forecast in numbers of physicians (“headcount”) and patient care full-time equivalents (FTEs).
The model uses an agent-based, or microsimulation, approach to estimating future physician supply. This means that all physicians involved in patient care – and their career decisions from training through retirement – are estimated individually in the model.
A physician “agent” can enter the model in one of two ways. First, all physicians active in patient care in the US in 2013 are included in the model. Data on the demographic characteristics, specialty, and geographic distribution of these physicians were developed based on algorithms that combined data from the American Medical Association’s Masterfile and American Board of Medical Specialties’ certifications. These algorithms produced a baseline estimate of physician supply in 2013 by age, sex, specialty and geographic location.
Second, a physician can enter the supply model through the model’s Graduate Medical Education pipeline. We used data from the AAMC’s GME Track to estimate the demographic characteristics, location, specialty, length of training and probability of branching/switching specialties while in training of each new medical resident in the U.S.
In each year after a physician “enters” the model, the model updates 1) the number of patient care FTEs that physician will provide in the year; and 2) that physician’s geographic location.
The model accounts not only for how much a physician works but also where a physician works. In each year in which a physician is considered clinically active in the model, the model calculates the probability that that individual physician will move. In this way, the model estimates patterns of physician migration between 2013 and 2030.
The model estimates individual physicians’ career decisions for the entire physician workforce between 2013 and 2030. The model then aggregates the effects of the decisions to develop overall estimates of physician supply in terms of both headcount and patient care FTE and by specialty, age, and gender.
2.2 The pipeline: residents entering nephrology
The UNC model uses GME Track as its data source of residents. This data source collects data based on the number of years that a resident has been previously recorded in the survey. This means that a PGY1 resident would be recorded as having not appeared in previous years in the GME Track survey. PGY 2 residents would have appeared in one previous year of data. However, there are some exceptions:
If a physician completed Internal Medicine residency in an AOA-only approved program, then entered nephrology residency in an ACGME approved residency, they would be recorded in GME Track in PGY1 although they would really be in PGY4.
If a physician has moved between specialties, for example, initially entering residency in a transitional program for two years before entering Internal Medicine and then subsequently nephrology residency program, GME Track would record such a PGY 5 resident as PGY6.
Noting these caveats, Table 3 displays the number of nephrology residents by approximate PGY training level between 2000 to 2013.
Table 3. Years Recorded in GME Track Survey
| Year | PGY1 | PGY2 | PGY3 | PGY4 | PGY5 | PGY6 | PGY7 | PGY8 | PGY9+ |
|---|---|---|---|---|---|---|---|---|---|
| 2000 | 23 | 31 | 31 | 294 | 321 | — | — | — | — |
| 2001 | 24 | 27 | 32 | 294 | 272 | 89 | — | — | — |
| 2002 | 18 | 33 | 27 | 298 | 317 | 71 | 21 | — | — |
| 2003 | 10 | 23 | 30 | 316 | 321 | 97 | 14 | 7 | — |
| 2004 | 12 | 15 | 21 | 319 | 338 | 100 | 21 | 6 | 1 |
| 2005 | 13 | 15 | 20 | 313 | 363 | 97 | 23 | 2 | 1 |
| 2006 | 14 | 17 | 12 | 327 | 348 | 94 | 15 | 5 | 1 |
| 2007 | 10 | 17 | 17 | 320 | 369 | 108 | 15 | 4 | — |
| 2008 | 11 | 13 | 18 | 343 | 365 | 108 | 19 | 2 | — |
| 2009 | 16 | 12 | 10 | 384 | 374 | 102 | 23 | 1 | — |
| 2010 | 9 | 17 | 8 | 392 | 405 | 88 | 20 | 5 | 1 |
| 2011 | 7 | 9 | 7 | 407 | 413 | 81 | 14 | 4 | — |
| 2012 | 15 | 7 | 6 | 401 | 426 | 72 | 17 | 1 | 3 |
| 2013 | 15 | 19 | 4 | 408 | 420 | 69 | 19 | 3 | — |
Table 3 shows that in 2013 there were 408 and 420 nephrology trainees in PGY4 and PGY5 respectively. These PGY4 and PGY5 residents represent the vast majority (86.5%) of nephrology residents in 2013. Table 3 shows that 13% of residents are in either PGY1, 2, 3 or 6 and beyond. This 13% is broadly in line with the 13.4% of nephrology residents in the third year or more of training as reported in the 2015 survey of nephrology fellows.5
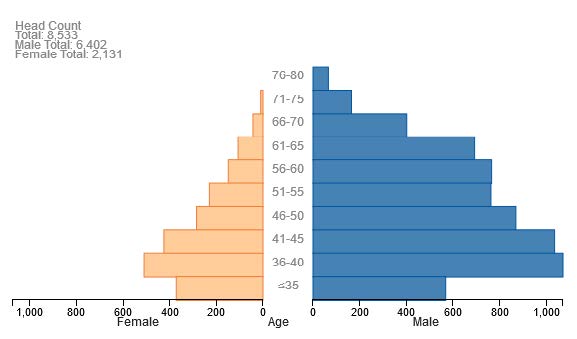
2.3 Nephrology gender-age breakdown
The UNC model’s baseline age and gender breakdown of the national nephrology workforce in 2013 is shown in Figure 8.
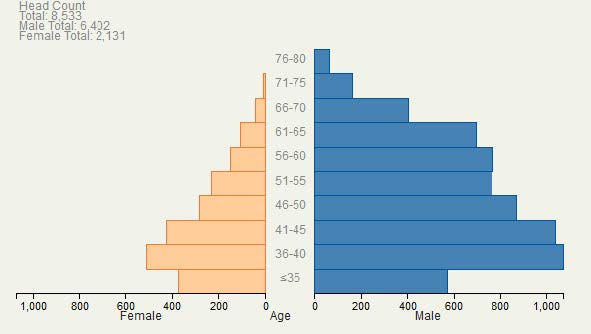
| Age Band | Female | Male |
|---|---|---|
| 76–80 | 0 | 66 |
| 71–75 | 10 | 165 |
| 66–70 | 43 | 402 |
| 61–65 | 107 | 693 |
| 56–60 | 149 | 766 |
| 51–55 | 230 | 763 |
| 46–50 | 285 | 870 |
| 41–45 | 425 | 1036 |
| 36–40 | 510 | 1072 |
| ≤35 | 372 | 569 |
2.4 Modeling FTE
The UNC model forecasts both the headcount and FTE of the nephrology workforce. The AMA Masterfile does not contain hours worked so we used licensure data from the North Carolina Health Professions Data System (HPDS) to estimate nephrology FTEs. Using these data, 1 FTE in nephrology is equivalent to 70 patient care hours per week. The HPDS data also show that the FTE of individual physicians varies depending on age and gender. To model individual physician FTEs, the UNC model makes the simplifying approach of grouping physicians into three categories:
Those working full time, i.e. FTE = 1
Those working part time, i.e. FTE = 0.5
Those not providing any patient care, i.e. FTE = 0
The UNC model assigns a FTE to a given physician depending on the probabilities of providing patient care full time, part time or not at all depending on the age and gender of the physician. These probabilities are illustrated in Figure 9.
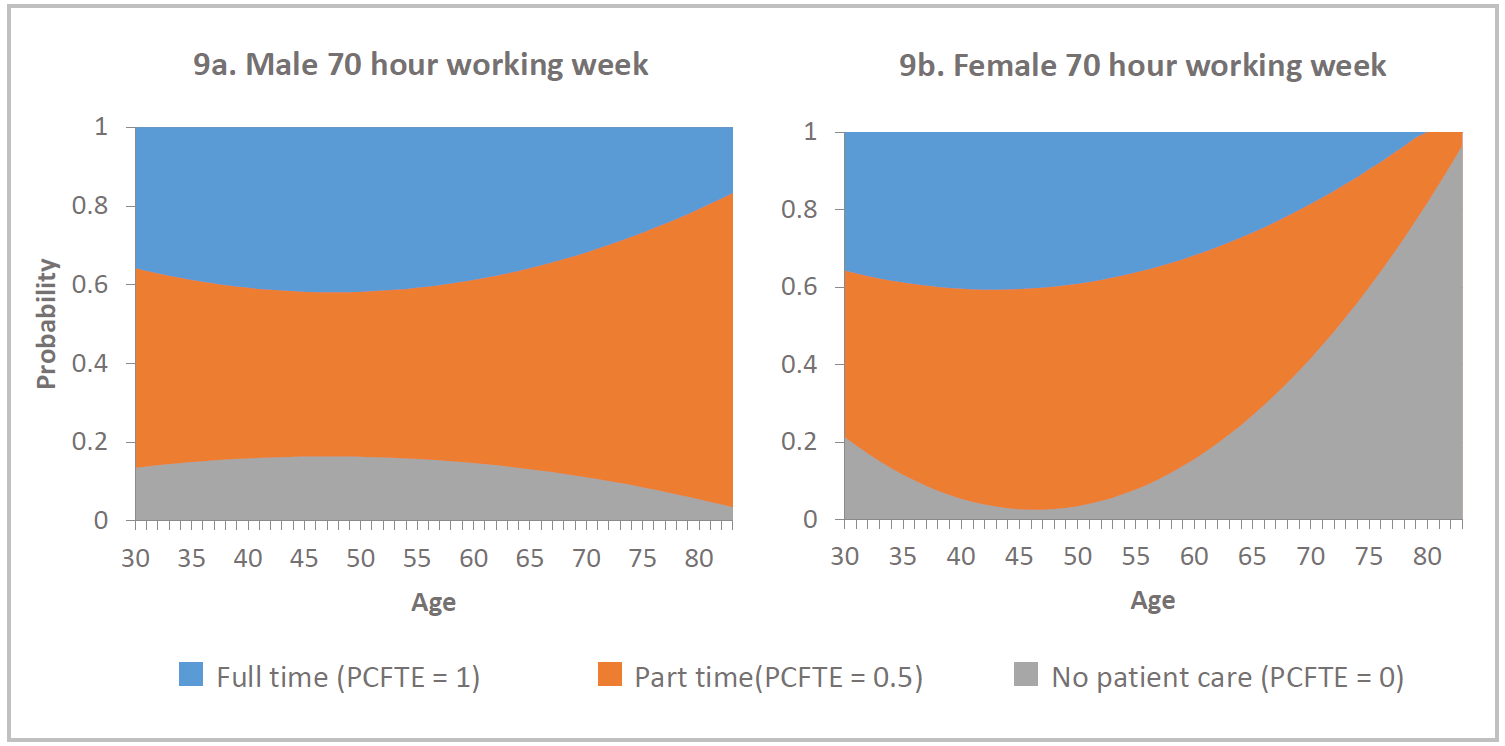
The chart shows for males, the probability of working part time increases with age – indicated by the widening of the orange band. However, for female physicians the probability of not providing any patient care increases from age 50 through to 80 – indicated by the increasing grey region. It is important to note that the FTE calculations for females over 50 is based on a small number of physicians and therefore may not be a good predictor of the behavior of future older female nephrologists.
2.5 Retirement
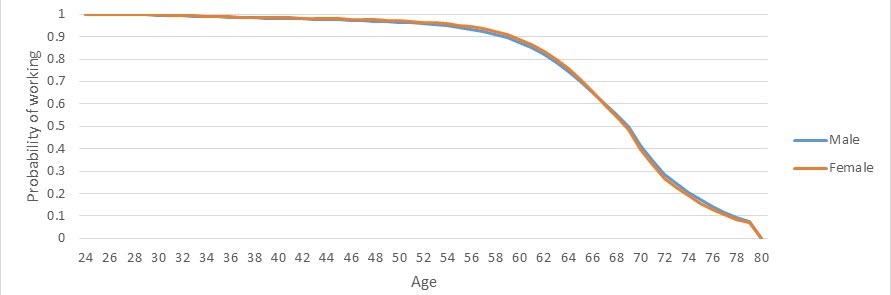
The model assumes that all physicians retire before reaching 80 years of age. The model also incorporates attrition from the workforce due to physician mortality. To estimate the mortality rates of clinically active physicians, the model uses population mortality rates by age and gender from the Centers for Disease Control and Prevention. Figure 10 displays a “survival curve” of physicians continuing to work.
2.6 Nephrology Supply Forecasts
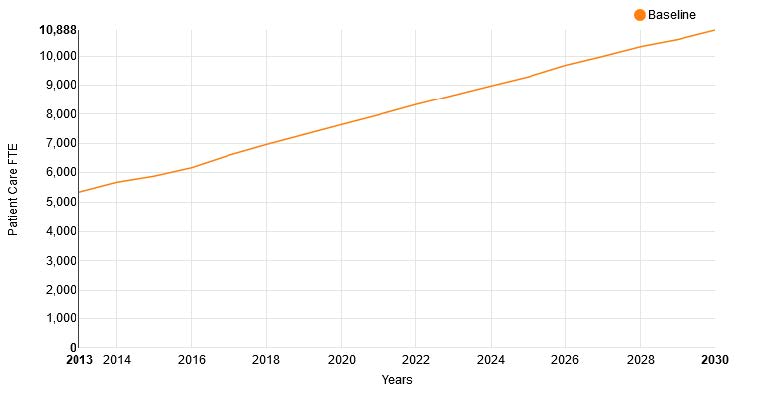
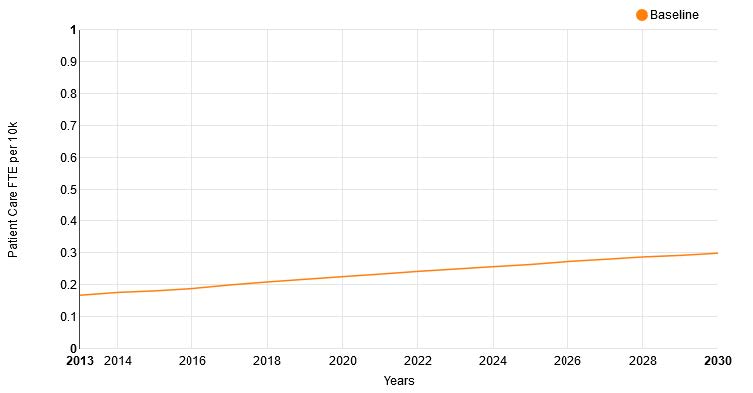
Figures 11 and 12 show the national supply forecasts from the UNC Model of the supply of nephrologists and supply per 10K of nephrologists between 2013 and 2030.
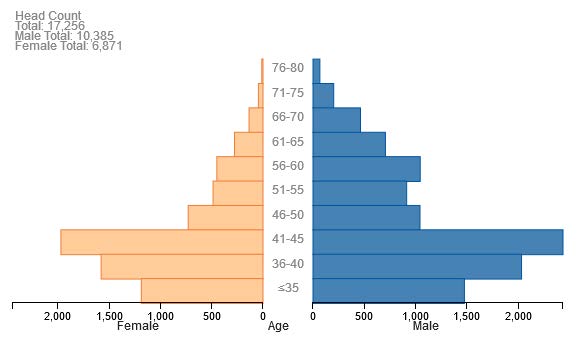
The UNC model also forecasts the change in the age and gender structure of the nephrology workforce (Figures 13a and 13b). This shows an increased number of females (indicated in light orange) in the workforce and an increased proportion of under 45 year old physicians. Note the change in scale of the axis when comparing the two population pyramids.
Conclusion
This report has compared workforce trends in the nephrology workforce reported by the ASN’s Review of the US Nephrology Workforce 2015 Report to findings from a physician projection model developed by researchers at the University of North Carolina at Chapel Hill. The UNC and ASN analyses agree on many findings, including that the nephrology workforce is maldistributed with some markets at, or above, saturation and others facing workforce shortages. One way to address this maldistribution would be to expand graduate medical education training in undersupplied areas and/or expand the use of nurse practitioners or physician assistants. Medical students and residents-in-training may be interested in the findings from the ASN and UNC analyses as they choose where to train and practice as a nephrologist. The UNC model may be updated shortly and UNC researchers would welcome the opportunity to continue to work with GW and the ASN on nephrologist workforce analyses.
Appendix 1. Conditions included in the Circulatory and Genitourinary Clinical Service Areas
| Circulatory | Genitourinary |
|---|---|
| Essential hypertension [98.] | Nephritis; nephrosis; renal sclerosis [156.] |
| Hypertension with complications and secondary hypertension [99.] | Acute and unspecified renal failure [157.] |
| Heart valve disorders [96.] | Chronic kidney disease [158.] |
| Acute myocardial infarction [100.] | Urinary tract infections [159.] |
| Coronary atherosclerosis and other heart disease [101.] | Calculus of urinary tract [160.] |
| Nonspecific chest pain [102.] | Other diseases of kidney and ureters [161.] |
| Pulmonary heart disease [103.] | Other diseases of bladder and urethra [162.] |
| Other and ill-defined heart disease [104.] | Genitourinary symptoms and ill-defined conditions [163.] |
| Conduction disorders [105.] | Hyperplasia of prostate [164.] |
| Cardiac dysrhythmias [106.] | Inflammatory conditions of male genital organs [165.] |
| Cardiac arrest and ventricular fibrillation [107.] | Other male genital disorders [166.] |
| Congestive heart failure; nonhypertensive [108.] | Nonmalignant breast conditions [167.] |
| Acute cerebrovascular disease [109.] | Inflammatory diseases of female pelvic organs [168.] |
| Occlusion or stenosis of precerebral arteries [110.] | Endometriosis [169.] |
| Other and ill-defined cerebrovascular disease [111.] | Prolapse of female genital organs [170.] |
| Transient cerebral ischemia [112.] | Menstrual disorders [171.] |
| Late effects of cerebrovascular disease [113.] | Ovarian cyst [172.] |
| Peripheral and visceral atherosclerosis [114.] | Menopausal disorders [173.] |
| Aortic; peripheral; and visceral artery aneurysms [115.] | Female infertility [174.] |
| Aortic and peripheral arterial embolism or thrombosis [116.] | Other female genital disorders [175.] |
| Other circulatory disease [117.] | |
| Phlebitis; thrombophlebitis and thromboembolism [118.] | |
| Varicose veins of lower extremity [119.] | |
| Hemorrhoids [120.] | |
| Other diseases of veins and lymphatics [121.] |
Footnotes
Salsberg E, Quigley L, Masselink L, Wu X, Collins A. The US Nephrology Workforce 2015: Developments and Trends. Washington, DC: American Society of Nephrology; 2015. https://www.asn-online.org/education/training/workforce/Nephrology_Workforce_Study_Report_2015.pdf↩︎
FutureDocs Forecasting Tool. Program on Health Workforce Research and Policy, Cecil G. Sheps Center for Health Services Research, University of North Carolina at Chapel Hill, with funding from The Physicians Foundation. https://www2.shepscenter.unc.edu/workforce/↩︎
For more information on regions, see https://www2.shepscenter.unc.edu/workforce/about.php, “What is a Tertiary Service Area?”↩︎
For more information on CSAs, see https://www2.shepscenter.unc.edu/workforce/about.php, “What is a Clinical Service Area?”.↩︎
Masselink L, Salsberg E, Wu X, Quigley L, Collins A. Report on the 2015 Survey of Nephrology Fellows. Washington, DC: American Society of Nephrology; 2016. https://www.asn-online.org/education/training/workforce/Nephrology_Fellow_Survey_Report_2015.pdf↩︎