| Percent Responding “No jobs” or “Very few jobs”* | ||||||
| Market | USMGs | IMGs | ||||
|---|---|---|---|---|---|---|
| 2014 | 2015 | 2016 | 2014 | 2015 | 2016 | |
| Local | 35.1% | 35.2% | 18.0% | 56.3% | 61.3% | 37.5% |
| National | 13.1% | 5.6% | 4.0% | 29.9% | 16.5% | 12.5% |
| *This reflects the percentages for those who had searched for a position. | ||||||
The US Adult Nephrology Workforce 2016 Developments and Trends
workforce
fellow
survey
report
GWU HWI
GWU’s Third Annual Report Finds a Mixed Picture of the Nephrology Workforce
Edward Salsberg, MPA
Leo Quigley, MPH
Nicholas Mehfoud, MS
George Washington University School of Nursing
Leah Masselink, PhD
GW Milken Institute School of Public Health
Ashté Collins, MD
George Washington University Medical Faculty Associates
1. Report Highlights
George Washington University Health Workforce Institute’s (GWU-HWI’s) third annual report on the nephrology workforce finds a mixed picture overall, with both positive and negative signs. Nephrology continues to face some real challenges, including the continued poor performance in the National Resident Matching Program (NRMP) Match for 2016/17 and a tight job market for new graduates, leading to uncertainty as to whether the nation is training more nephrologists than the delivery system can easily absorb. A survey of nephrologists over 55 found that while most were satisfied with their specialty, practice, and income, they were generally less satisfied than 5 years ago. While the job market for new nephrologists is still challenging, there were some bright spots especially for US medical school graduates (USMGs) as job prospects improved along with incomes. Job opportunities for international medical graduates (IMGs) continued to be very limited.
One encouraging development for nephrologists appears to be the ESRD Seamless Care Organization (ESCO) demonstration projects. This approach to financing and organizing services for ESRD patients offers the possibility of improving the care of patients and the satisfaction of nephrologists, including through the development of more comprehensive teams, and could make the specialty more attractive to new physicians.
Growth of the Specialty
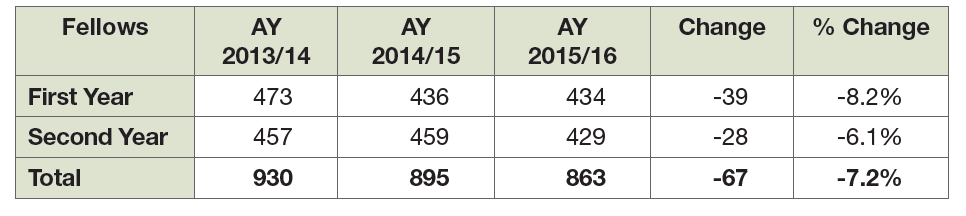
After several years of growth, the number of physicians entering adult nephrology—as measured by first-year fellows in Accreditation Council for Graduate Medical Education (ACGME)–accredited adult nephrology training programs—decreased from 473 in 2013/14 to 434 in 2015/16, an 8% decrease. However, preliminary numbers from 2016/17 indicate a slight increase. The longer term trend in positions and applicants remains unclear.
Despite this uncertainty on the number of trainees in the coming years, the basic trend in total supply is clear: continued growth for the foreseeable future. Based on recent levels of entrants and estimates of historical rates of retirements, the number of full-time equivalent (FTE) adult nephrologists is projected to grow 76% between 2016 and 2030. This reflects the fact that the number in training in recent years is well above the numbers 20 and 30 years ago. Our survey of nephrologists aged 55 years and older indicates that many adult nephrologists expect to work until they are in their late 60s or early 70s. The nation is now training more than 430 new adult nephrologists per year. This is equal to a 5-year total of around 2150 new adult nephrologists. The number of active nephrologists in each of the 5-year cohorts between age 50 and 69 is about 1200 or less; hence, the inflow is considerably higher than the outflow.
The percentage of nephrologists who are female is growing slowly. While 25% of all active nephrologists (and only 13.5% of active nephrologists over age 60) are female, 36% of nephrology fellows—the future workforce—are female. While this is encouraging, 41% of all IM residents and 44% of all residents and fellows are female, thus nephrology is not attracting a representative share of this important part of the physician workforce.
Results of the Nephrology Match
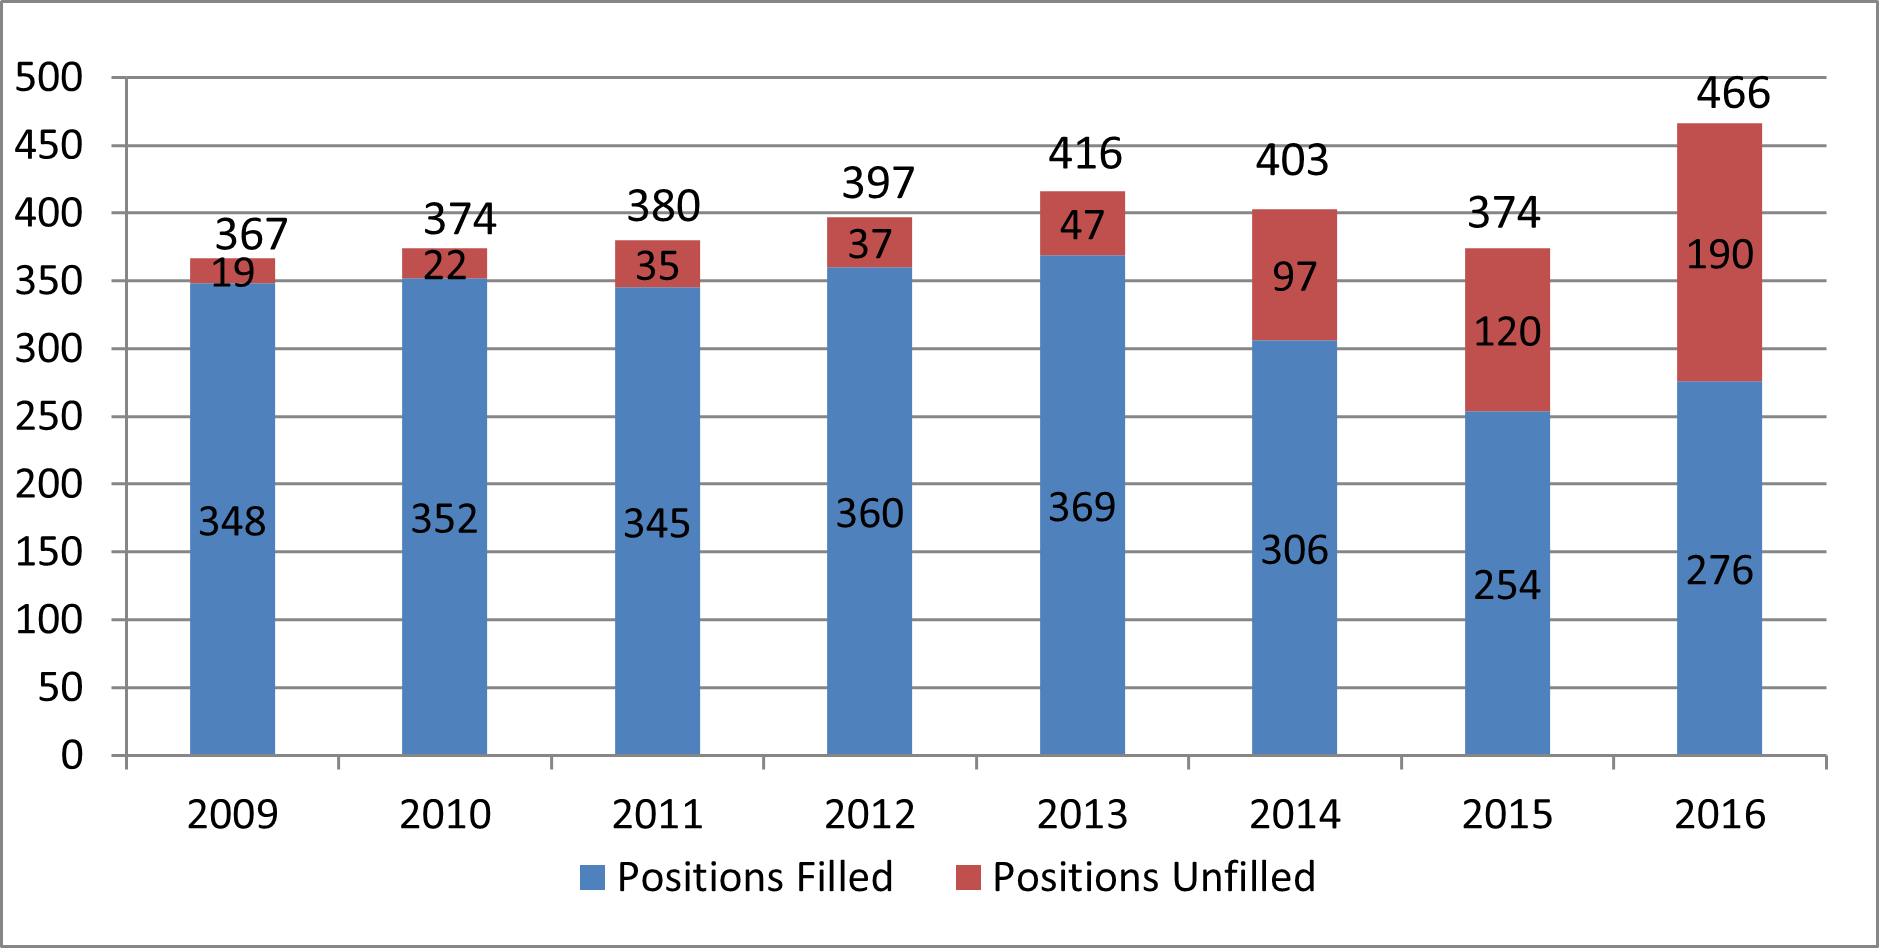
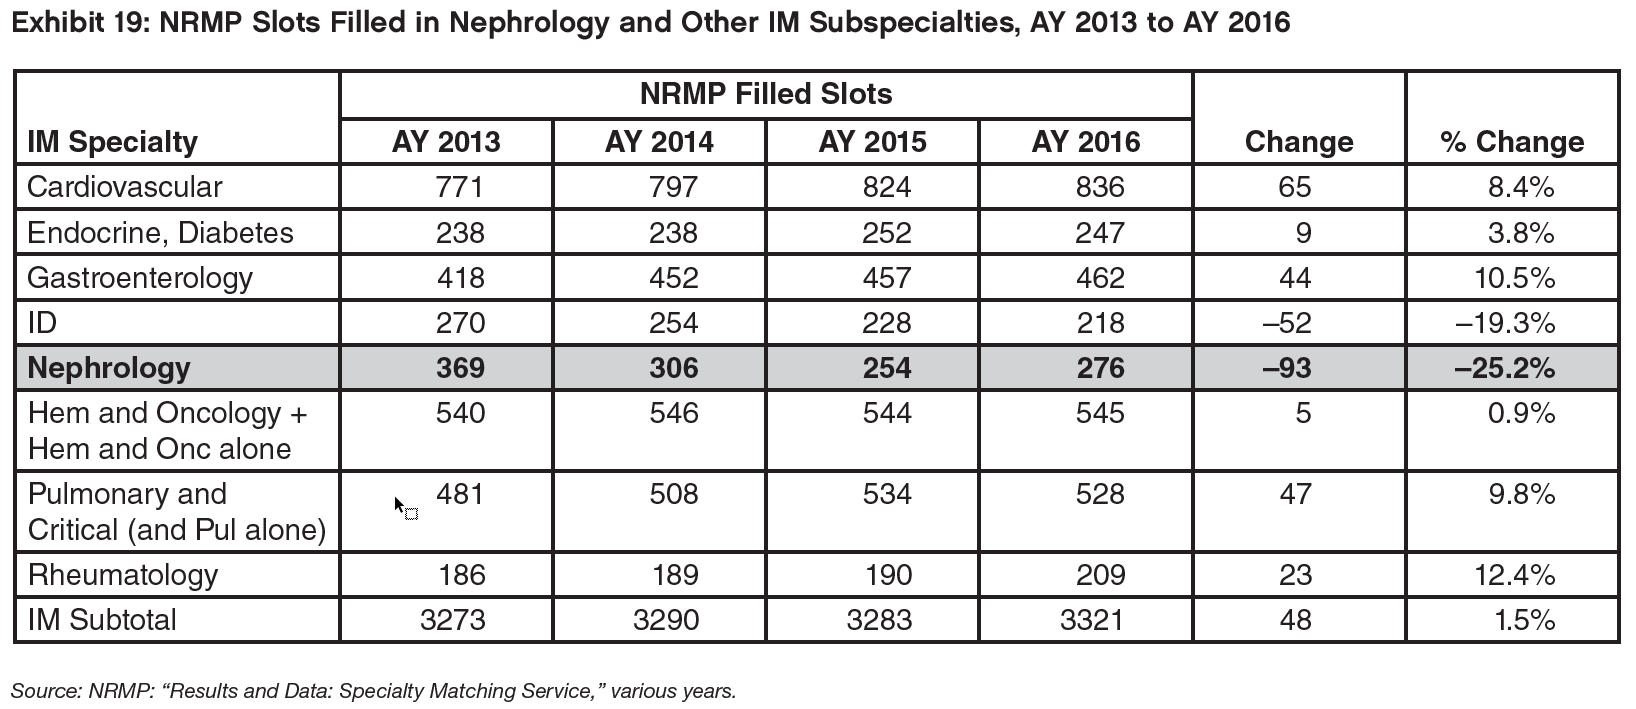
While the National Resident Matching Program (NRMP) nephrology Match results present only a partial picture of the future adult nephrology workforce (about 60% of the eventual adult nephrology fellows were matched through the NRMP in 2014/15 and 2015/16), it does provide valuable information. The number of matches made in the 2016/17 Match was higher than the previous year (going from 254 to 276); however, this likely reflects a large increase in nephrology positions offered in the Match (from 374 to 466) and is attributable to the first year of the All-In Policy. The number of adult nephrology matches remains low compared to the previous decade, when it was as high as 369 in 2013/14; in fact, the nephrology Match rate was the lowest of any internal medicine (IM) subspecialty in the Specialty Matching Service (SMS) Match in 2016/17.
The fact that positions offered went up more rapidly than applicants led to a further decrease in the ratio of applicants to positions down to .6 applicants for every offered position.
The drop in matches was caused by a sharp decrease in non-US international medical graduates (IMGs) being matched. From 2013/14 to 2016/17, the number of non-US IMGs matched dropped from 189 to 100, a decrease of 47%. The reason for this is unclear; the flow of non-US IMGs into other IM subspecialties over this period was generally stable. None experienced the level of decrease experienced by nephrology.
It is too early to know if the decrease in ACGME positions between 2013/14 and 2015/16 along with an improving job market noted below will lead to an increase in applicants and a higher Match rate.
The Marketplace for New Adult Nephrologists: Results of the 2016 Survey of Fellows
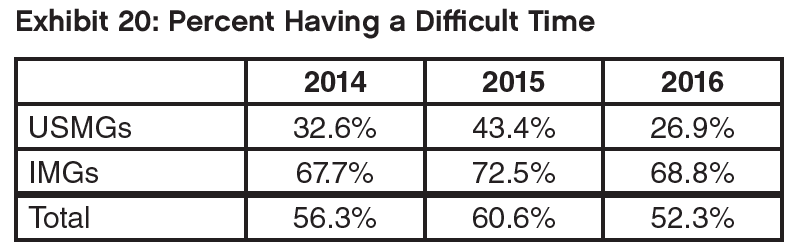
In 2016, 52.3% of fellows completing an adult nephrology fellowship who had searched for a job indicated it was difficult to find a satisfactory position; this was less than 2015 and 2014 (60.3% and 56.3%, respectively.) USMGs continue to have significantly less difficulty than IMGs (26.9% vs. 68.8%).
US medical and osteopathic graduates (USMGs) were also significantly less likely to report changing their plans because of limited opportunities than IMGs, although the overall percentage changing plans declined slightly since 2015.
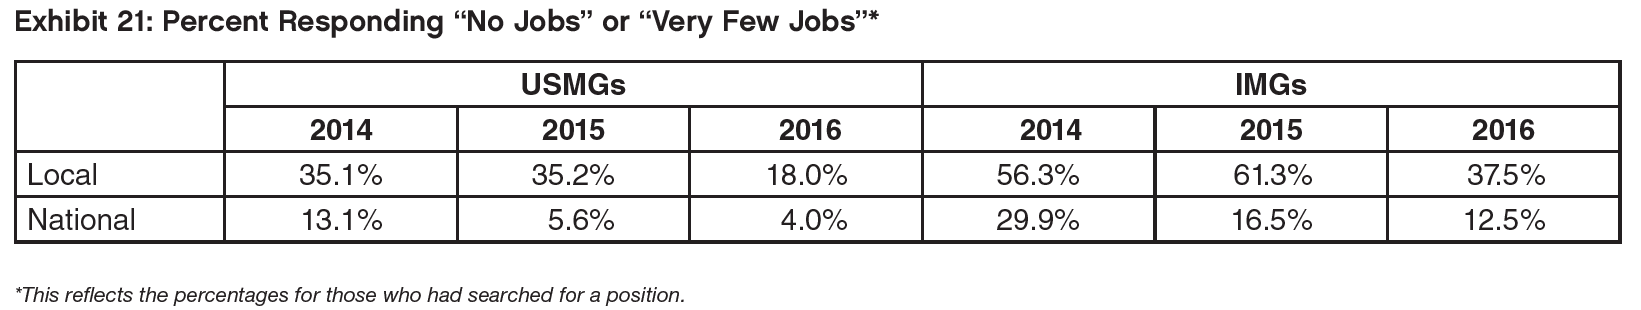
There was a notable decrease in the percent of USMGs and IMGs that reported no or very few jobs in the local job market and the views of the national job market improved as well.
IMGs applied for high numbers of jobs at about the same rate in 2016 as in 2015, but their likelihood of receiving no job offers declined slightly.
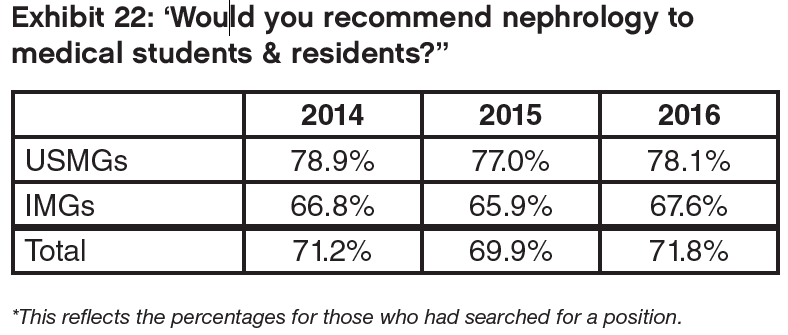
The percentage of USMG and IMG nephrology fellows who indicated they would recommend the specialty to residents and medical students (71.8%) increased slightly compared to 2015.
The average income (base income plus incentives) of new nephrologists with confirmed practice plans was estimated to be $193,000. This is 3% higher than the $187,000 estimated for 2015 graduates.
Survey of Nephrologists Age 55 and Over
A survey of nephrologists aged 55 and over conducted by GWU-HWI for ASN found that these nephrologists are generally quite satisfied with most aspects of their career and benefits. Eighty-nine percent were very satisfied or satisfied with their career in medicine and nephrology, and 84% with their current position. Their satisfaction is further demonstrated by the fact that only 25% said they would retire if they could afford to.
Only 6% of respondents reported their financial status as ‘poor’ or ‘fair’ compared to 72% who reported ‘excellent or ’very good’ financial status. In addition, 94% reported their overall health status as ‘good,’ ‘very good,’ or ‘excellent.’
Most have relatively high incomes with the median income in the range of $275,000 to $299,999. Men on average reported higher incomes than women; this may reflect the fact that women were more likely to be working in academic practices (50% to 30%) and men were more likely to be practicing in group practices (50% to 32%). While 79% work 40 or more hours per week, most (60%) said part-time employment was available (28.5% said they were actually considering it) or that it wasn’t available but that they would like the option (31%). Most planned to work until their late 60s or early 70s; even among nephrologists aged 55 to 59, 74% expect to work at least to 65.
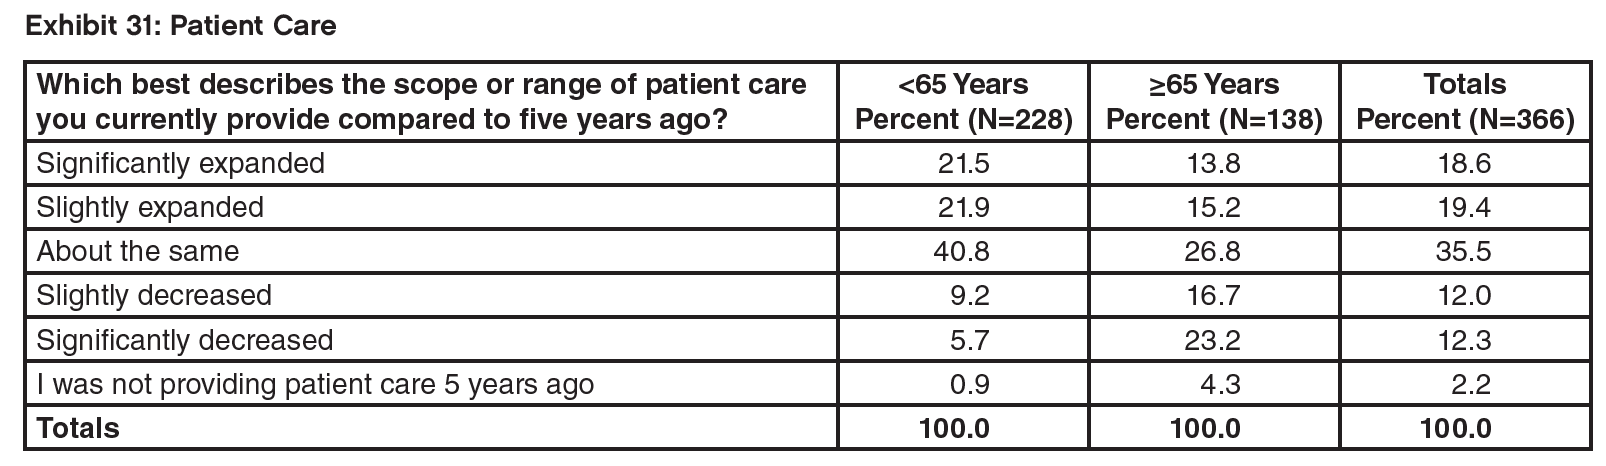
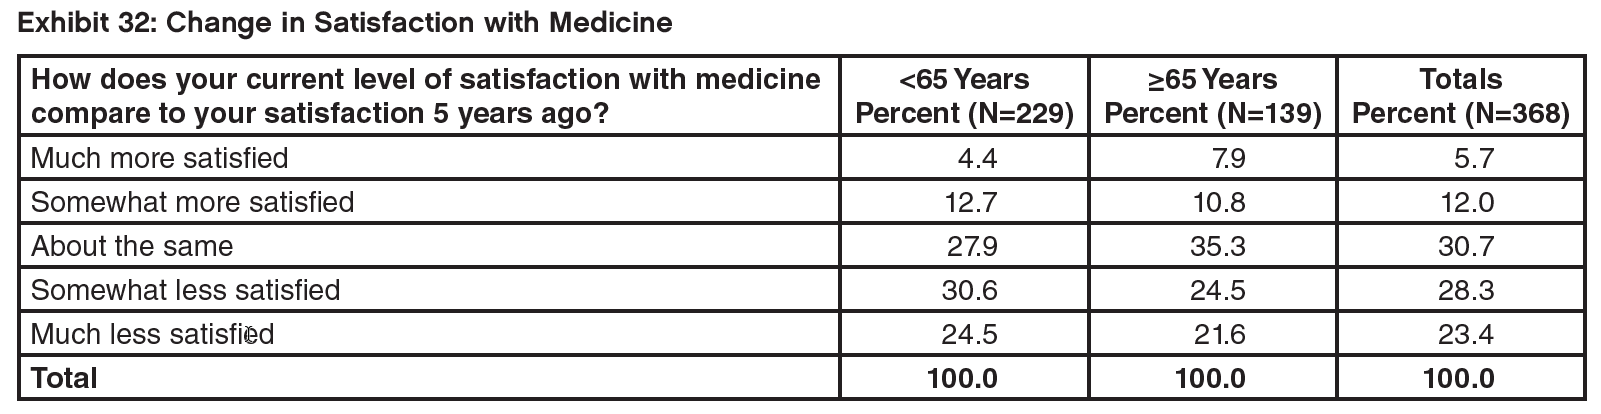
Perhaps reflecting the continual changes in medicine and nephrology, more respondents felt that the range of patient care they provided had increased over the past 5 years than felt it had decreased, and more of them reported being less satisfied with medicine than reported being more satisfied compared to 5 years ago.
The vast majority (83%) indicated they would recommend the specialty of nephrology to others.
The Changing Delivery System: ESCOs
To try to assess the potential impact of the introduction of the ESRD Seamless Care Organization (ESCO) model on the nephrology workforce, GWU-HWI staff began a series of interviews with ESCOs. With limited experience with the model to date, it is hard to judge the ultimate impact of the ESCO model on the supply/ demand/use of nephrologists. It appears that the model is encouraging the use of teams including additional NPs, RNs, care coordinators, and others.
While this could free up nephrologist time and/or reduce demand for nephrologists, the desire to improve coordination and management of patients along with the incentive to limit overall costs could end up expanding the role of the nephrologist to provide more services and care management and reduce referrals to other physicians and hospitals; this would increase the demand for nephrologists.
Some in the field believe there would be benefits to expanding the ESCO model to include pre-dialysis patients, often referred to as moving “upstream.” These patients would benefit from the care management, the ability to look at care options, and more preventive interventions.
Several representatives of ESCOs interviewed for this study noted the importance of cultural change for nephrologists to work effectively in the ESCO models, including working more closely in teams, managing patient care and reducing hospital use, and providing a wider range of services to achieve these goals. Most representatives felt there were many rewards for the nephrologist if he/she can make the needed cultural changes, including improved outcomes, greater control over their schedules and workload, and increased remuneration.
These changes in culture and practice also need to be taught to nephrologists in training.
2. Profile of Active Adult Nephrologists
There are several sources of data on physicians by specialty. According to the American Medical Association (AMA) Masterfile, as of January 2016, there were 10,883 physicians listing adult nephrology as their first or second specialty who were active in medicine. Not all of these physicians are working full time or practicing only nephrology. According to the American Board of Internal Medicine there were 10,607 board-certified adult nephrologists (March 2016). There were 11,046 physicians with a National Provider Identifier (NPI) listing adult nephrology as their first specialty (June 2016) and 2,017 additional physicians listing nephrology as their second specialty. Finally, the federal Centers for Medicare & Medicaid Services (CMS) recently released data on claims by physicians filed for Medicare patients under fee for service. Linking that data to the NPI determined that 8,037 physicians with a primary specialty of adult nephrology filed at least some Medicare claims in 2014 (Medicare Provider Utilization and Payment Data: Physician and Other Supplier Public Use File [Physician and Other Supplier PUF]). For the following profile, we rely on the AMA Masterfile which includes the most extensive data on each physician including data on their medical education and training.
As seen in Exhibit 1, the vast majority of active nephrologists (93%) are involved in patient care.
The age distribution of adult nephrologists in 5-year cohorts shows a relatively consistent number for the cohorts between 50 and 69 years, with some slight drop-off in the 65 to 69 cohort (Exhibit 2). For younger age cohorts the numbers grow. Despite the fact that the average age of completion of training is nearly 36 years, the age distribution of nephrology makes it one of the youngest specialties with 59% of active adult nephrologists under the age of 55.
As will be seen in the next section on graduate medical education, the nation is training about 435 or more fellows per year; this would yield a 5-year cohort of 2,175, well above the older cohorts. This is one reason for the relatively young average age of nephrologists and for the projected growth in the specialty.
Source: AMA Masterfile, January 2016.
As seen in the age distribution by sex (Exhibit 3), the vast majority of older nephrologists are male, which is consistent with medicine in general. Only 13.5% of active nephrologists over age 60 are female. But as can be seen, the percentage of nephrologists who are female in each age cohort is growing slowly. Overall, 25% of all active nephrologists are female. With 36% of nephrology fellows being female, the percentage of female practicing nephrologists will continue to increase.
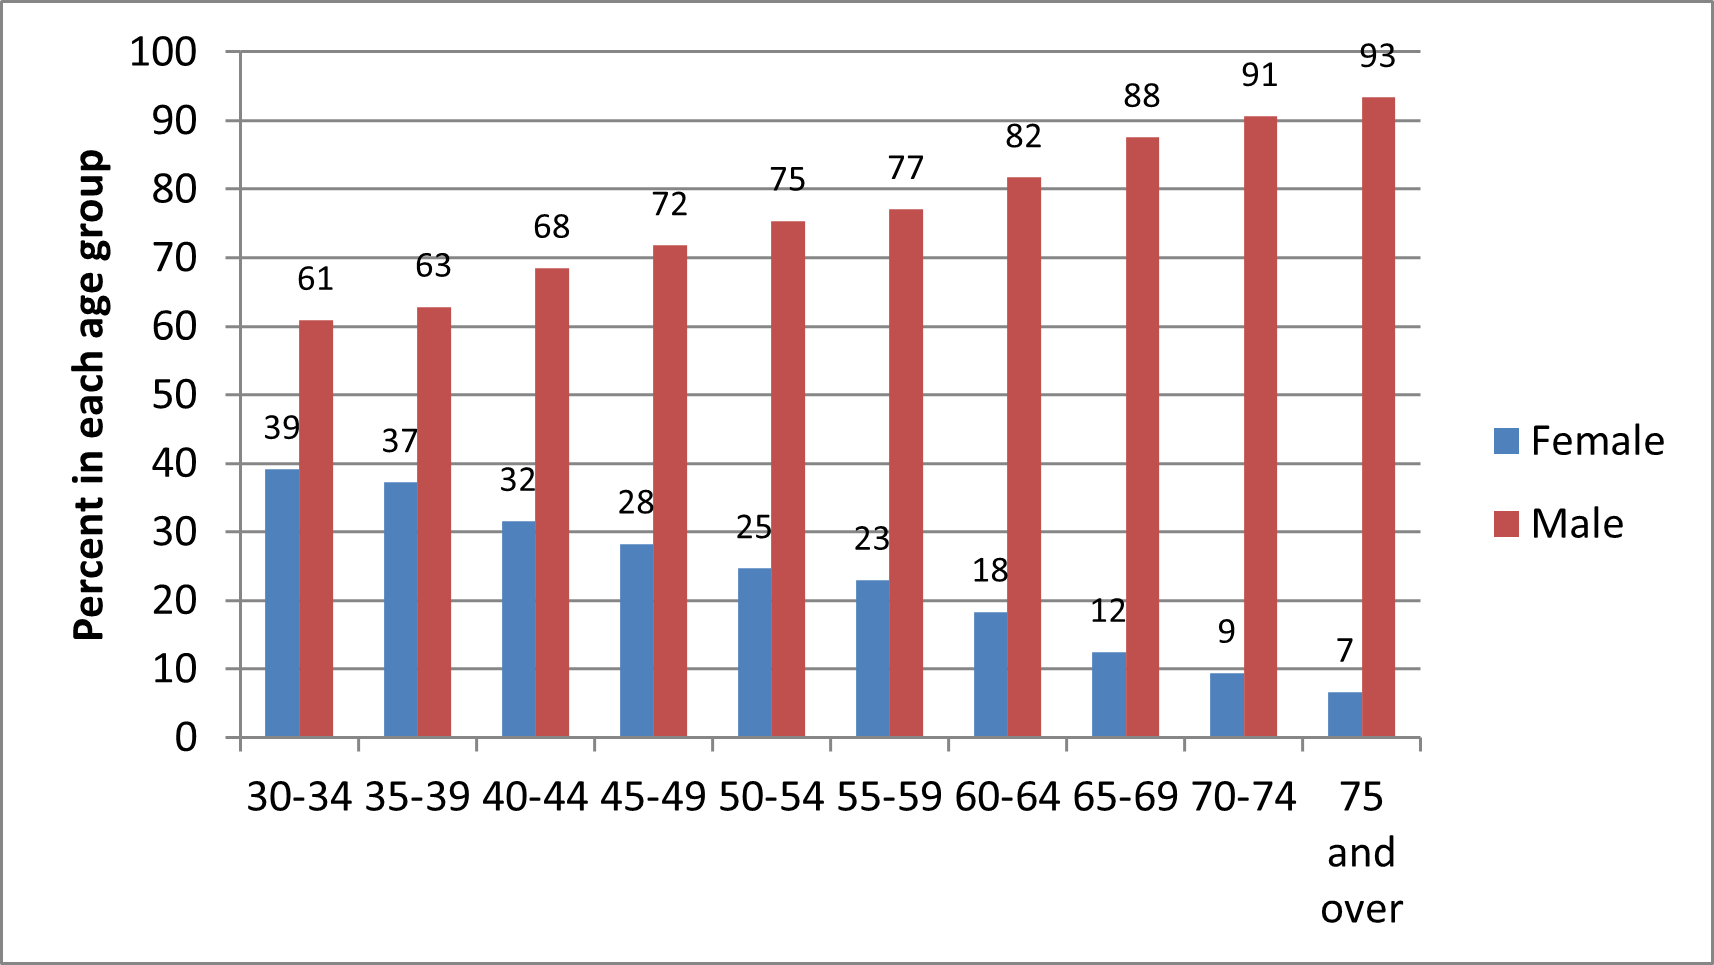
Source: AMA Masterfile, January 2016.
As seen in Exhibit 4, for the age cohorts above age 60 have a majority of USMDs compared to other types of medical education. This levels off for the 55 to 59 cohort with the number of USMGs equaling IMGs. For most of the younger age cohorts IMGs are the most prevalent type of education. In recent years, there has also been an increase in osteopathic physicians in the specialty.
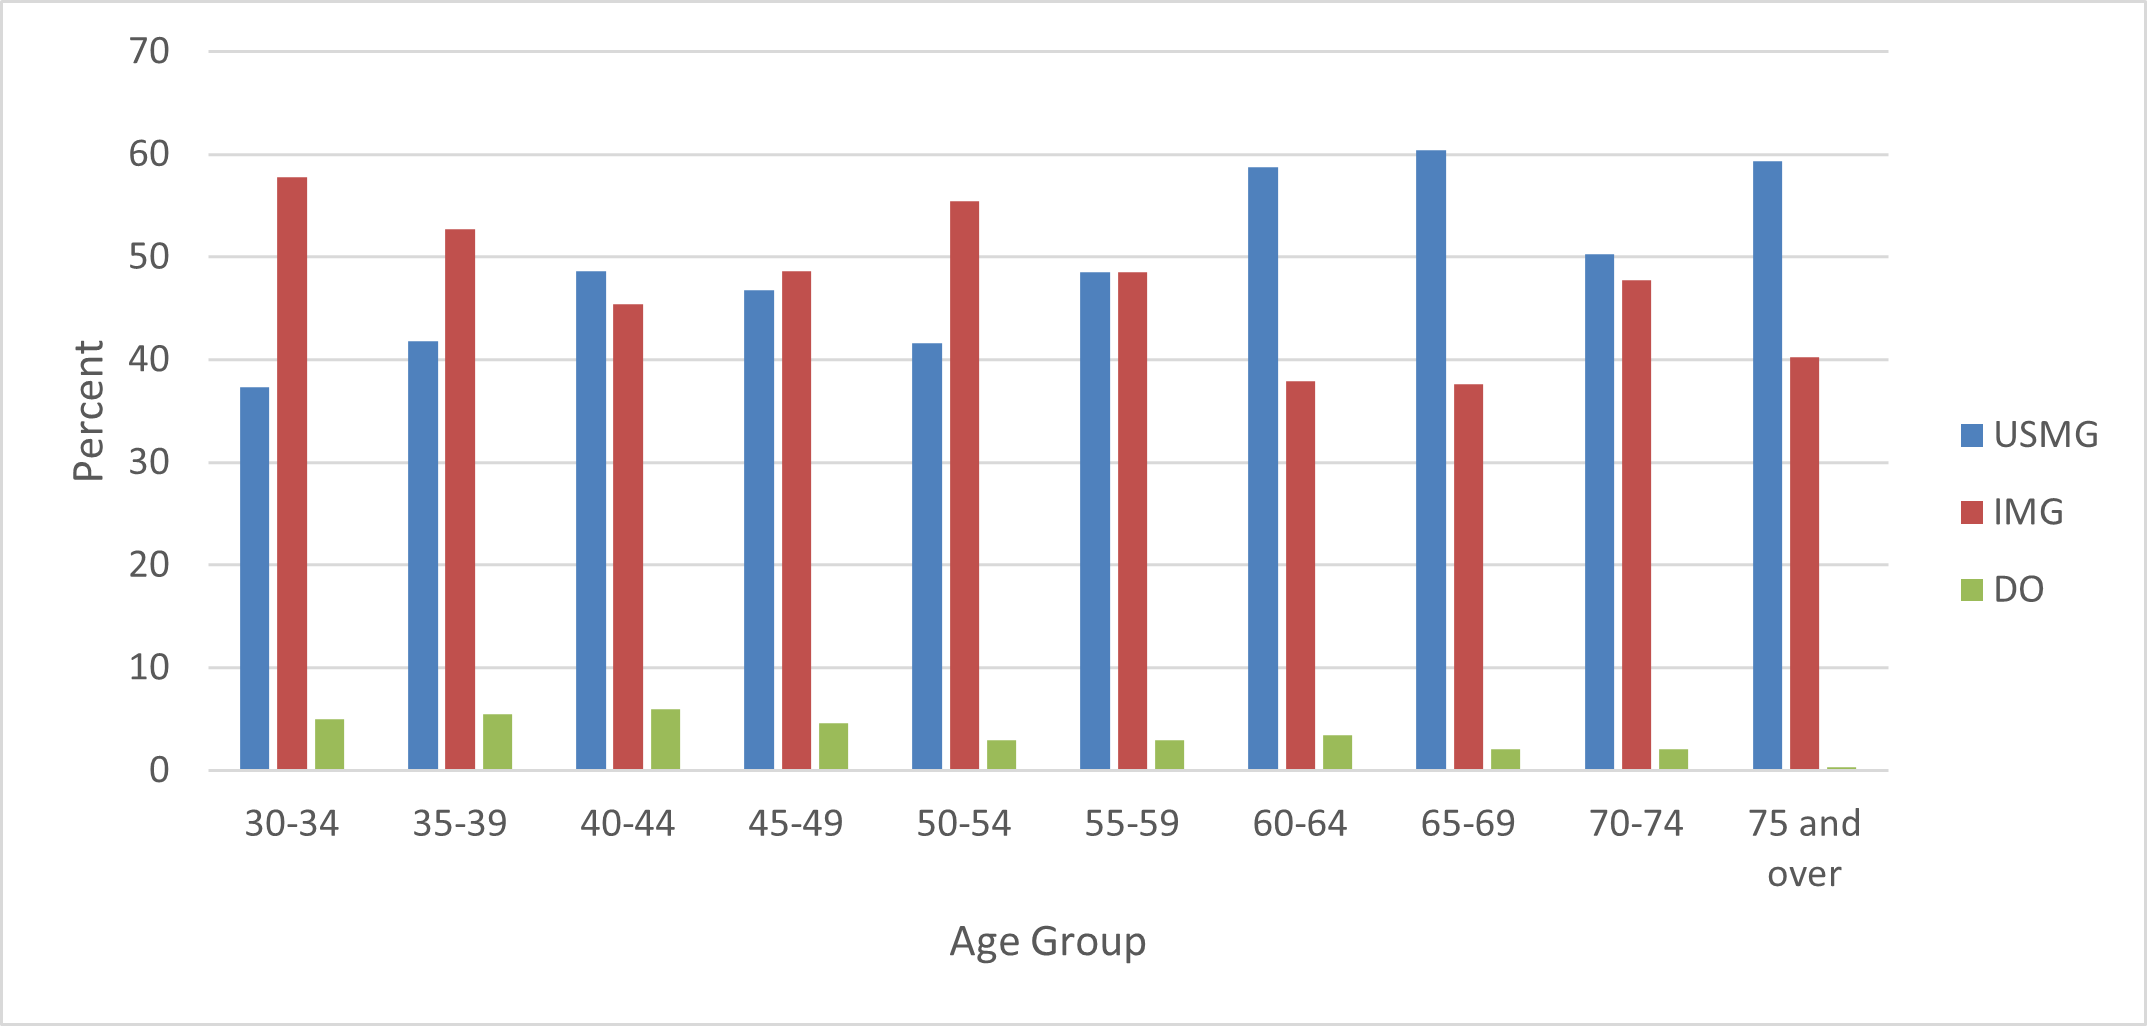
Source: AMA Masterfile, January 2016.
3. Graduate Medical Education
A. Description of Adult Nephrology Trainees and Trends
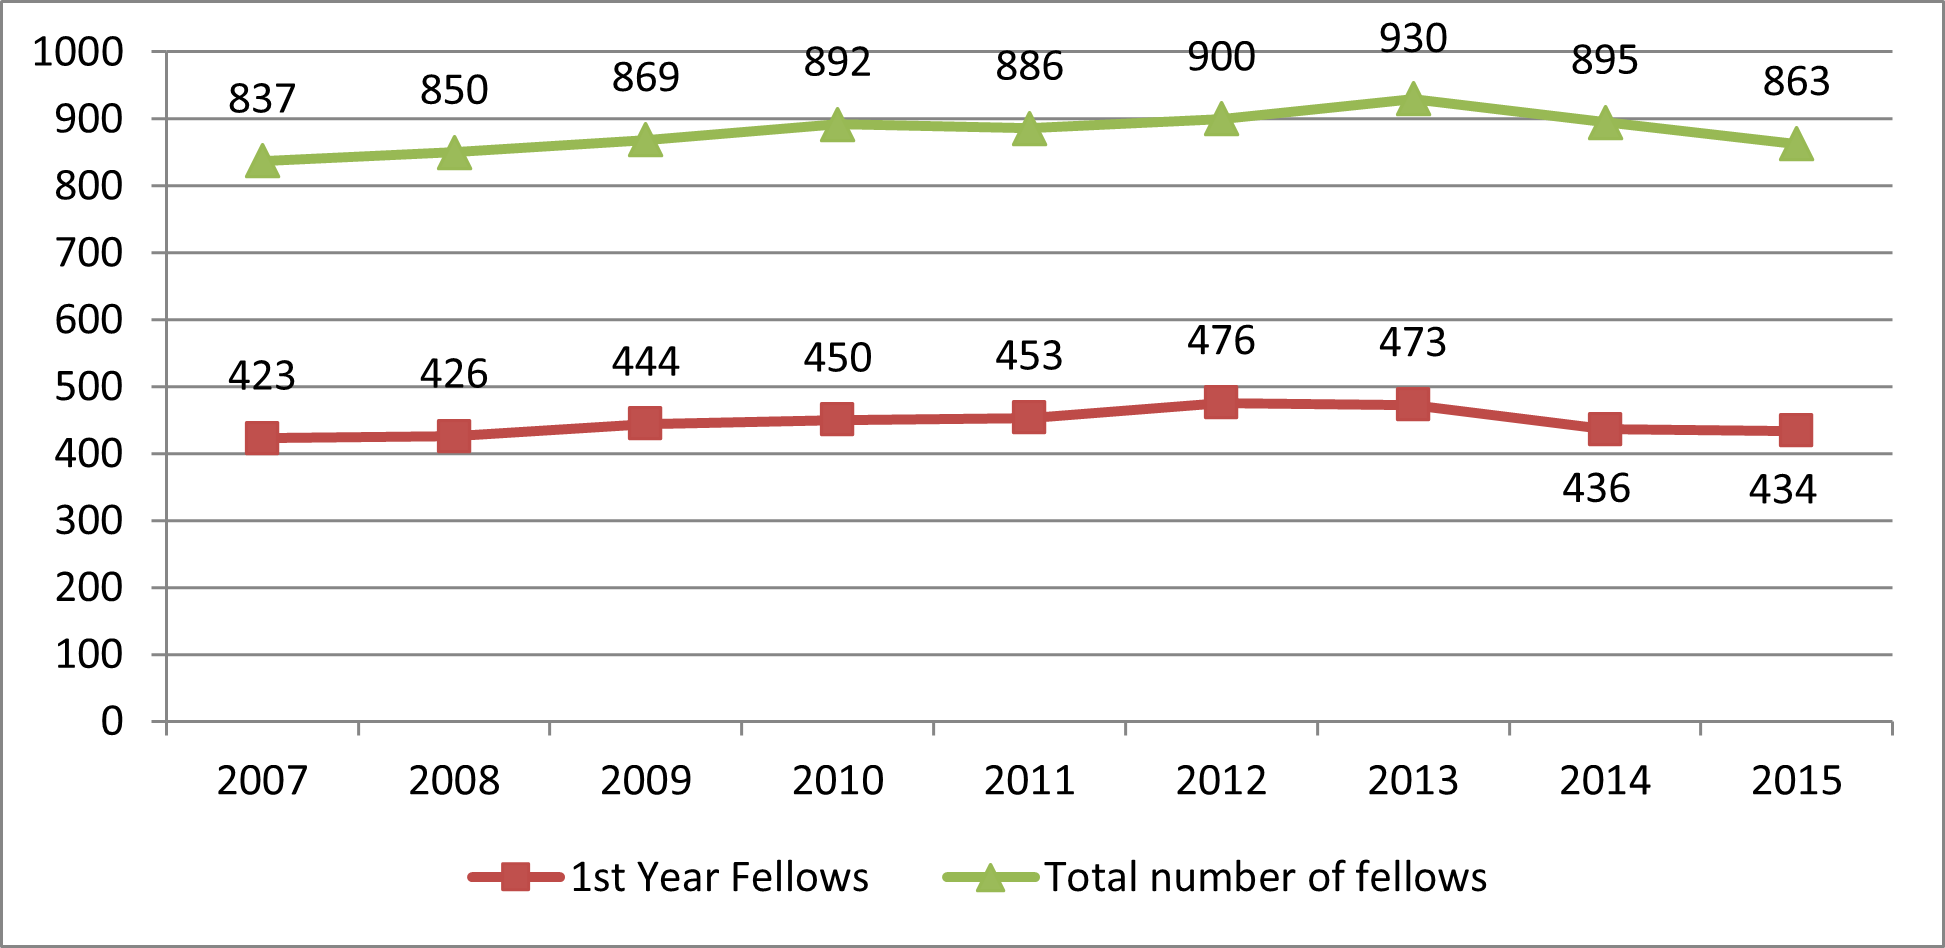
The number of new entrants (first-year fellows) trended upward from 2007 until 2013 before reversing. The same trend has been evident in the total number of fellows. Preliminary numbers from a new data system established by ASN indicates that there may have been a slight increase in 2016/17.
Source: ACGME Annual Data Resource Books.
The percentage of female adult nephrology fellows has been increasing commensurate with their increased representation in medicine. However, the increase in the percentage of females in nephrology has stopped and decreased a little (Exhibit 7) while the percentage in general medicine has continued to grow. In 2015/16, 41% of all Internal Medicine residents were female. It would be valuable to understand why nephrology is less attractive to women than other specialties.
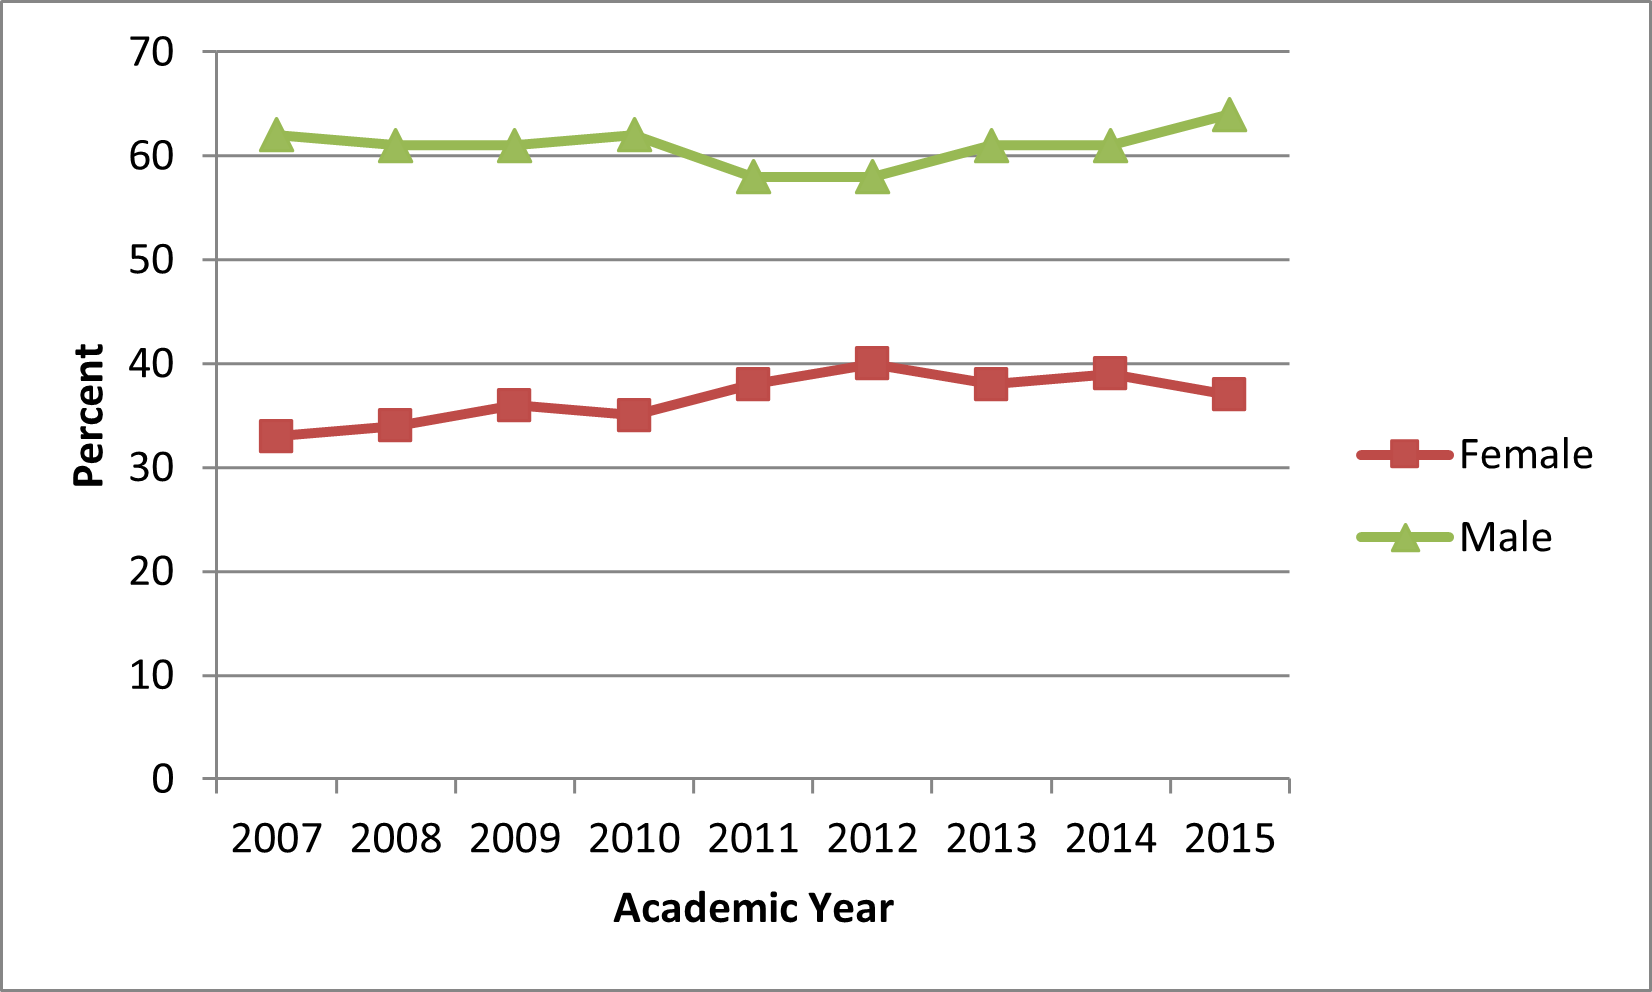
Source: ACGME Annual Data Resource Books.
As seen in Exhibit 8, there was significant and steady increase in the representation of IMGs in ACGME adult nephrology programs from 2007/08 to 2013/14, rising to nearly 70%. It has decreased since 2013/14 to 65% in 2015/16 but is still well above general IM which is at 40% IMG (Exhibit 9). Both of these are well above the total for all residents and fellows (25%).
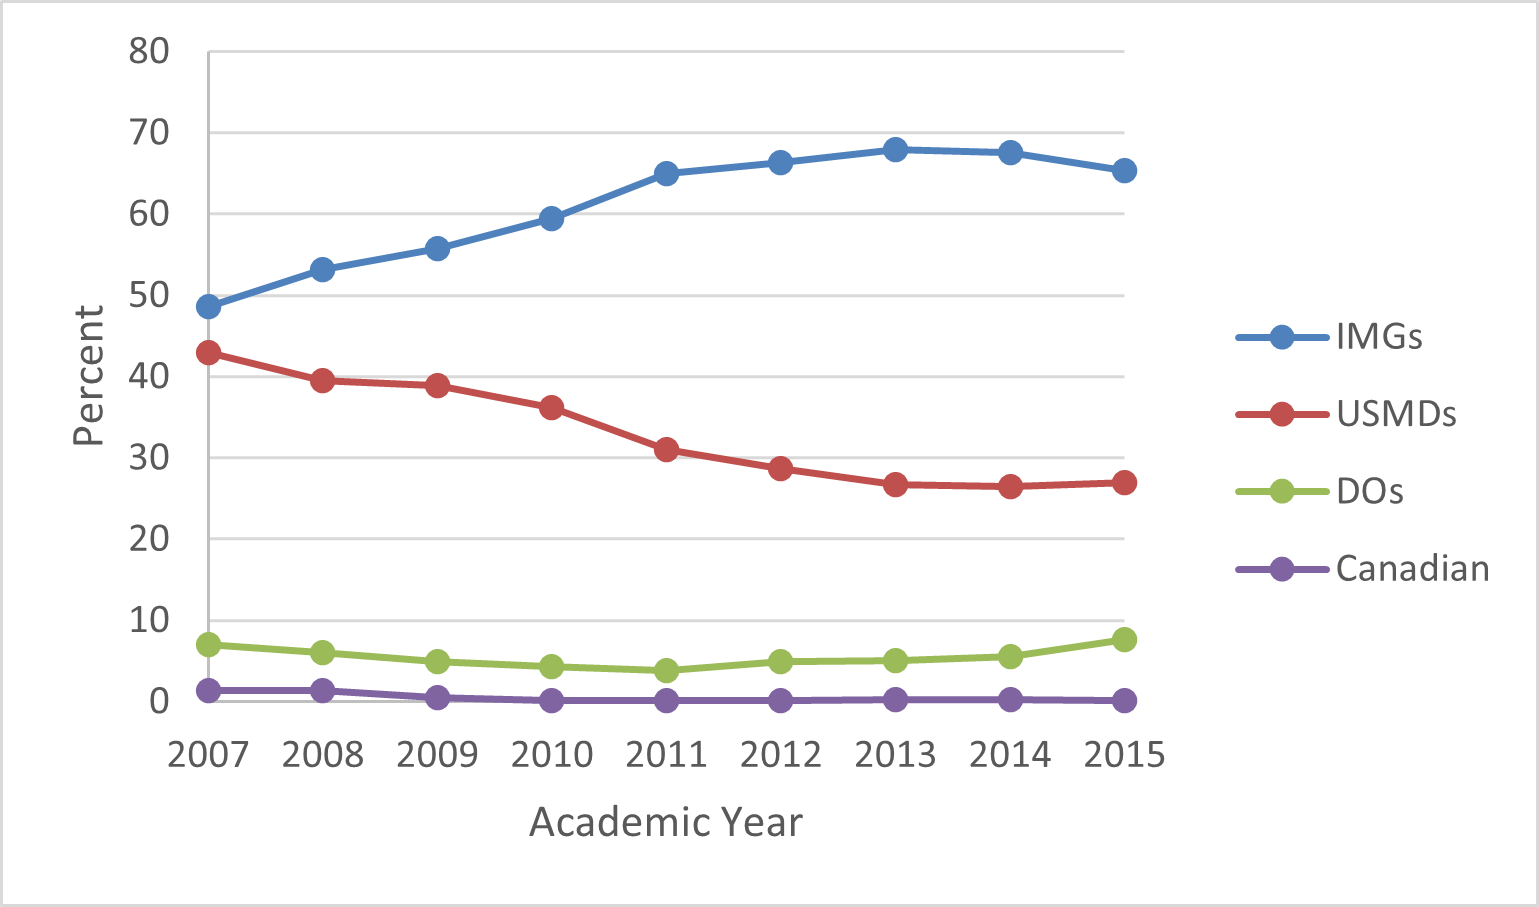
Source: ACGME Annual Data Resource Books; includes first- and second-year fellows.
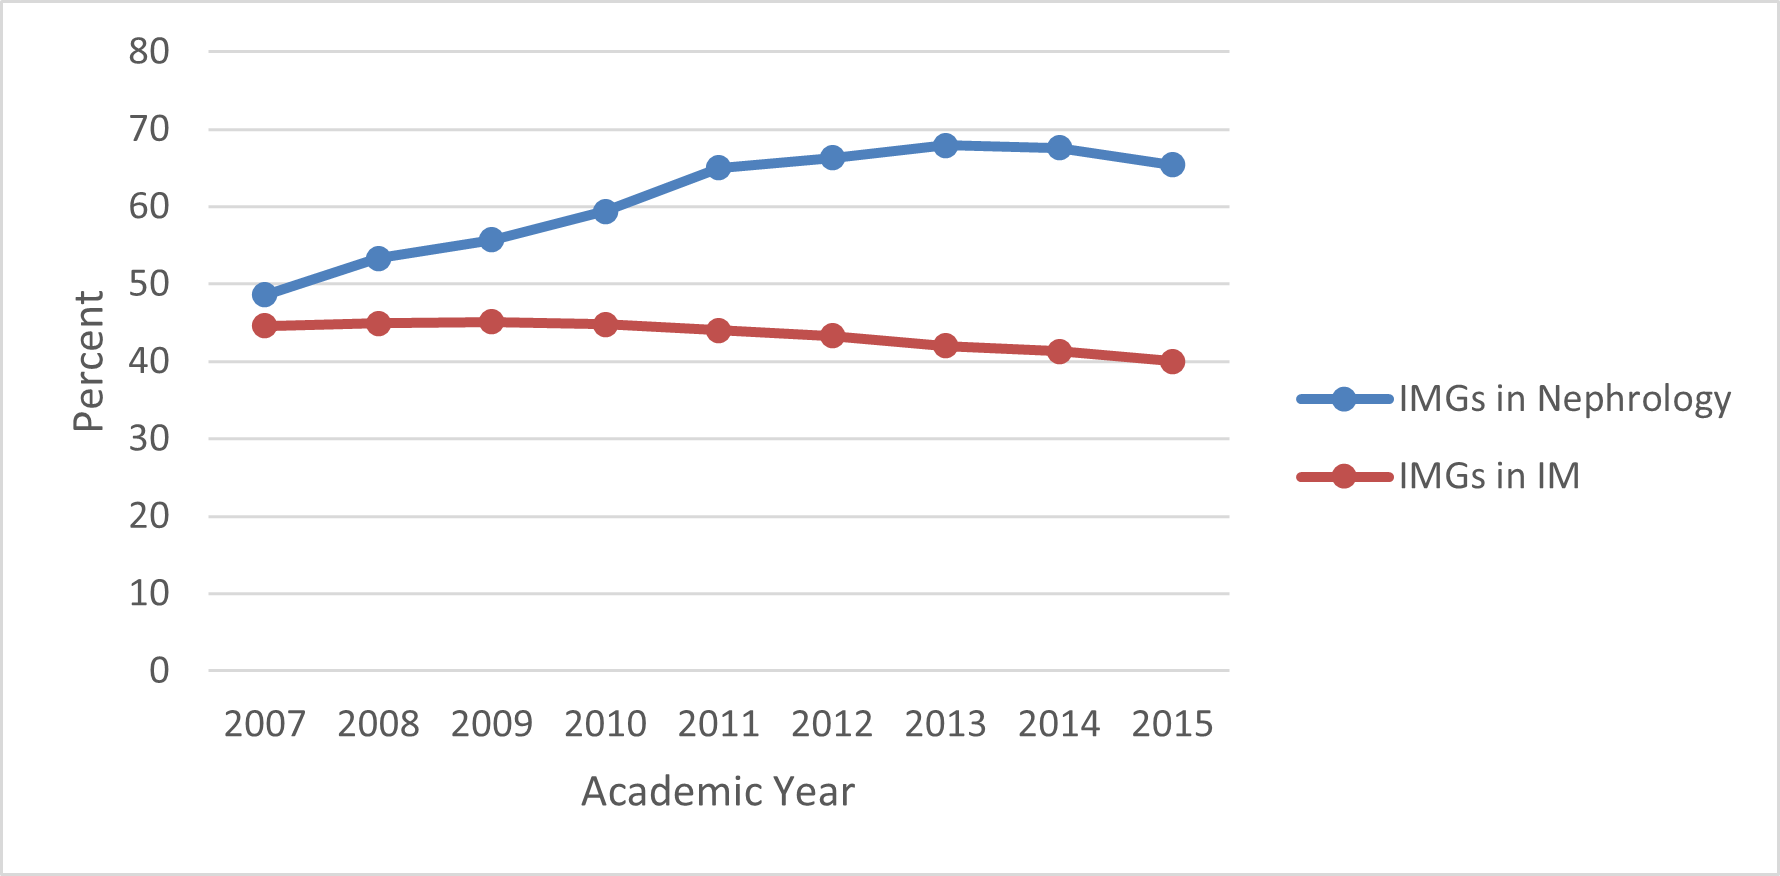
Source: ACGME Annual Data Resource Books; includes first- and second-year fellows.
The percentage of adult nephrology fellows who are DOs has also risen to 7.6% of fellows in 2015/16. However, this is below their representation in general IM (9.5%).
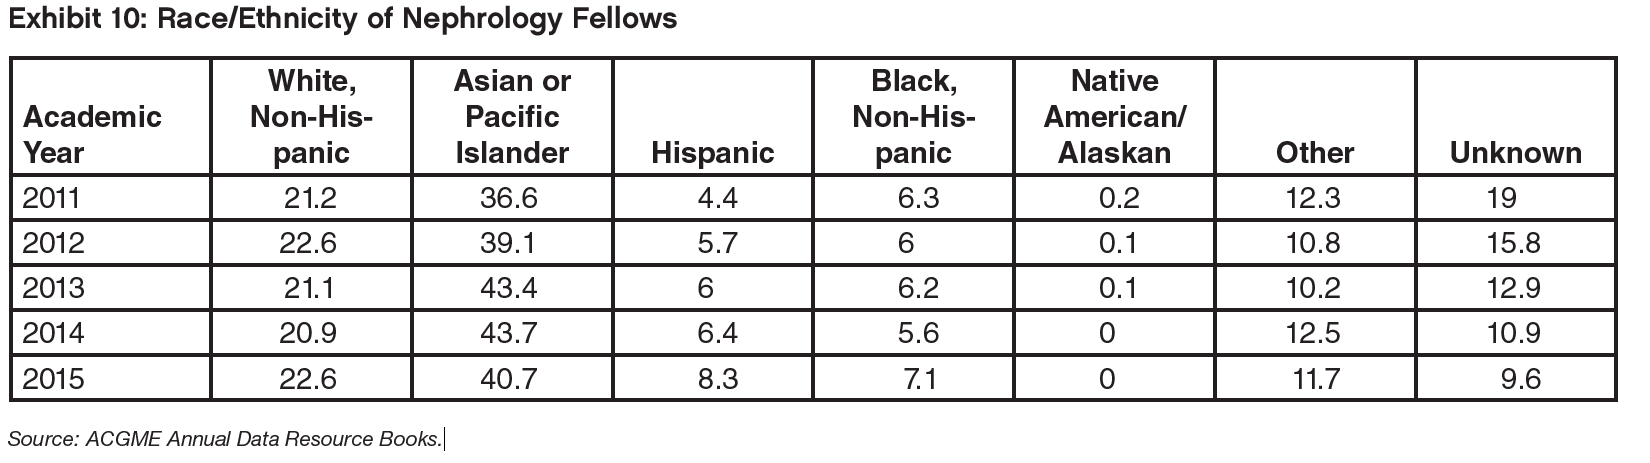
Exhibit 10 is the distribution of fellows by race and ethnicity. The most common background is “Asian or Pacific Islander” which reflects the high percent of IMGs from Asia. But the exhibit is hard to interpret, especially the real trends, since the percentage unknown dropped from around 20% to around 10% in a short period of time.
B. Results of the 2016/17 Nephrology Match and Trends Over Time
The number of adult nephrology positions offered in NRMP for the 2016/17 training year reached an all-time high reflecting the implementation of the All-In Policy. Although the numbers of matches increased in 2016, unfortunately, the number of unfilled positions also reached an all-time high. The number of matches was well below the number over the past 7 years other than 2015. From 2009 to 2016 the percent of offered positions that were unfilled grew from 5% of all positions to 41%.
Source: NRMP: “Results and Data: Specialty Matching Service,” various years.
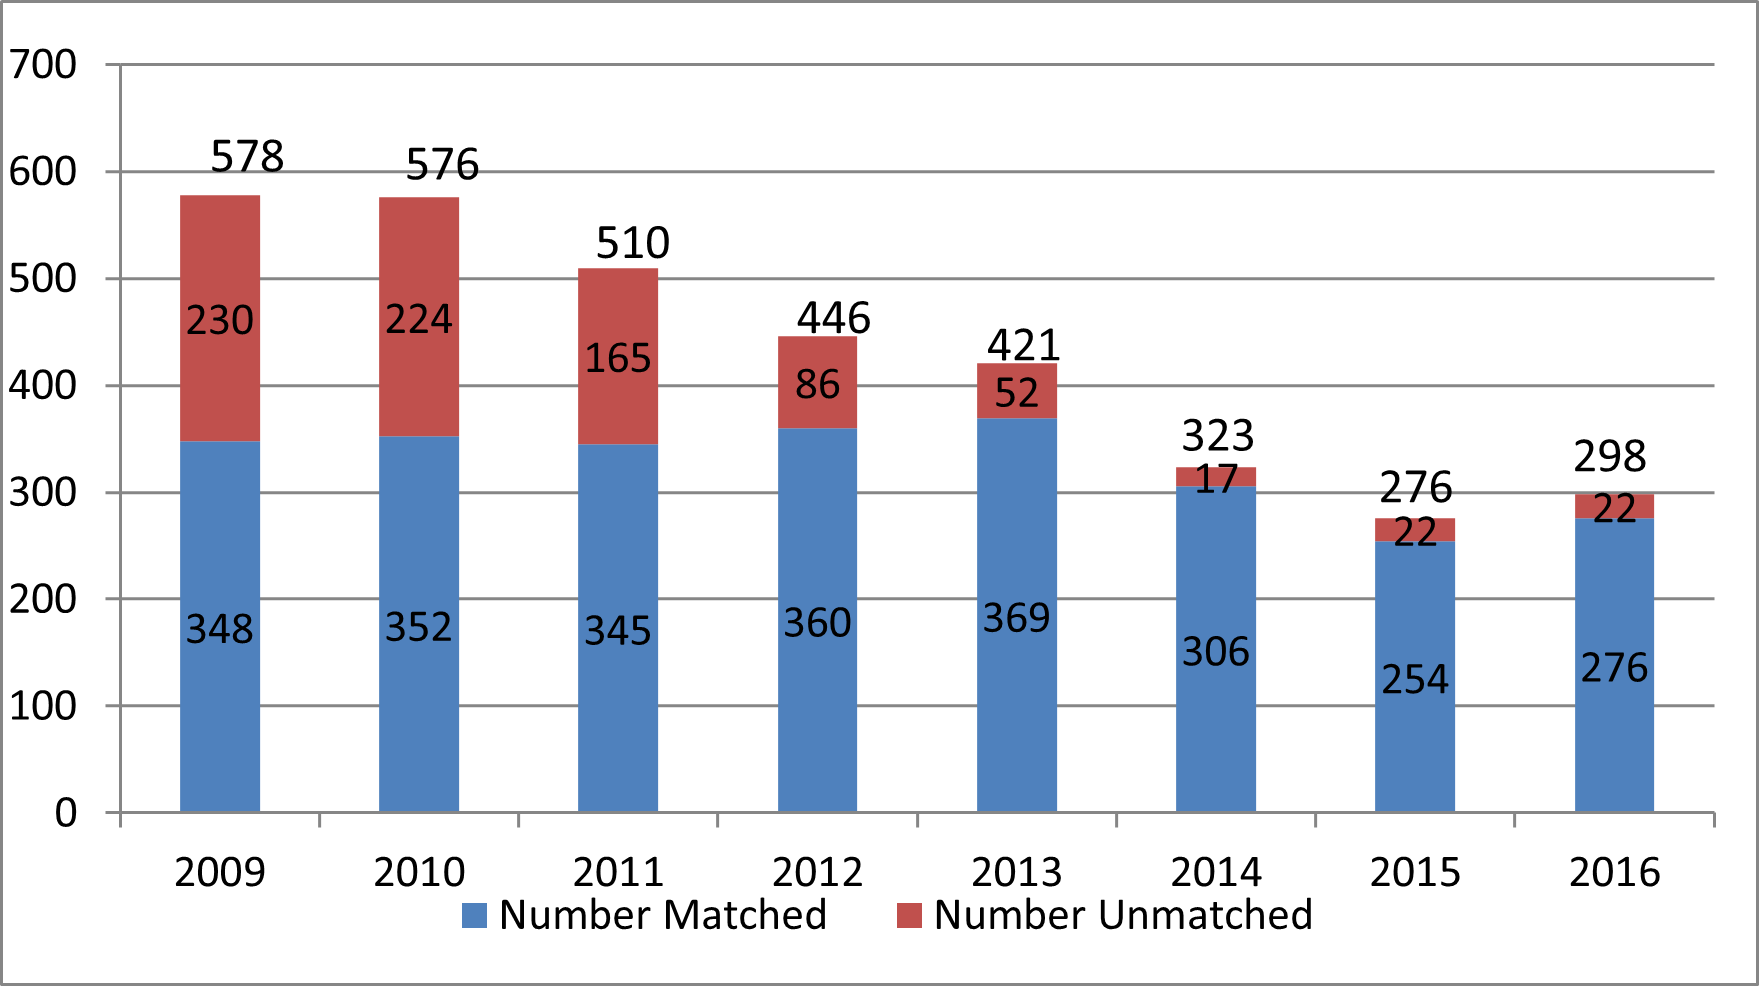
Similarly, there has been a large decrease since 2009 in the proportion of NRMP applicants left unmatched, from 40% of applicants to 7%. (Exhibit 12) The absolute fall in the number of unmatched application has been by a factor of 10.
Source: NRMP: “Results and Data: Specialty Matching Service,” various years.
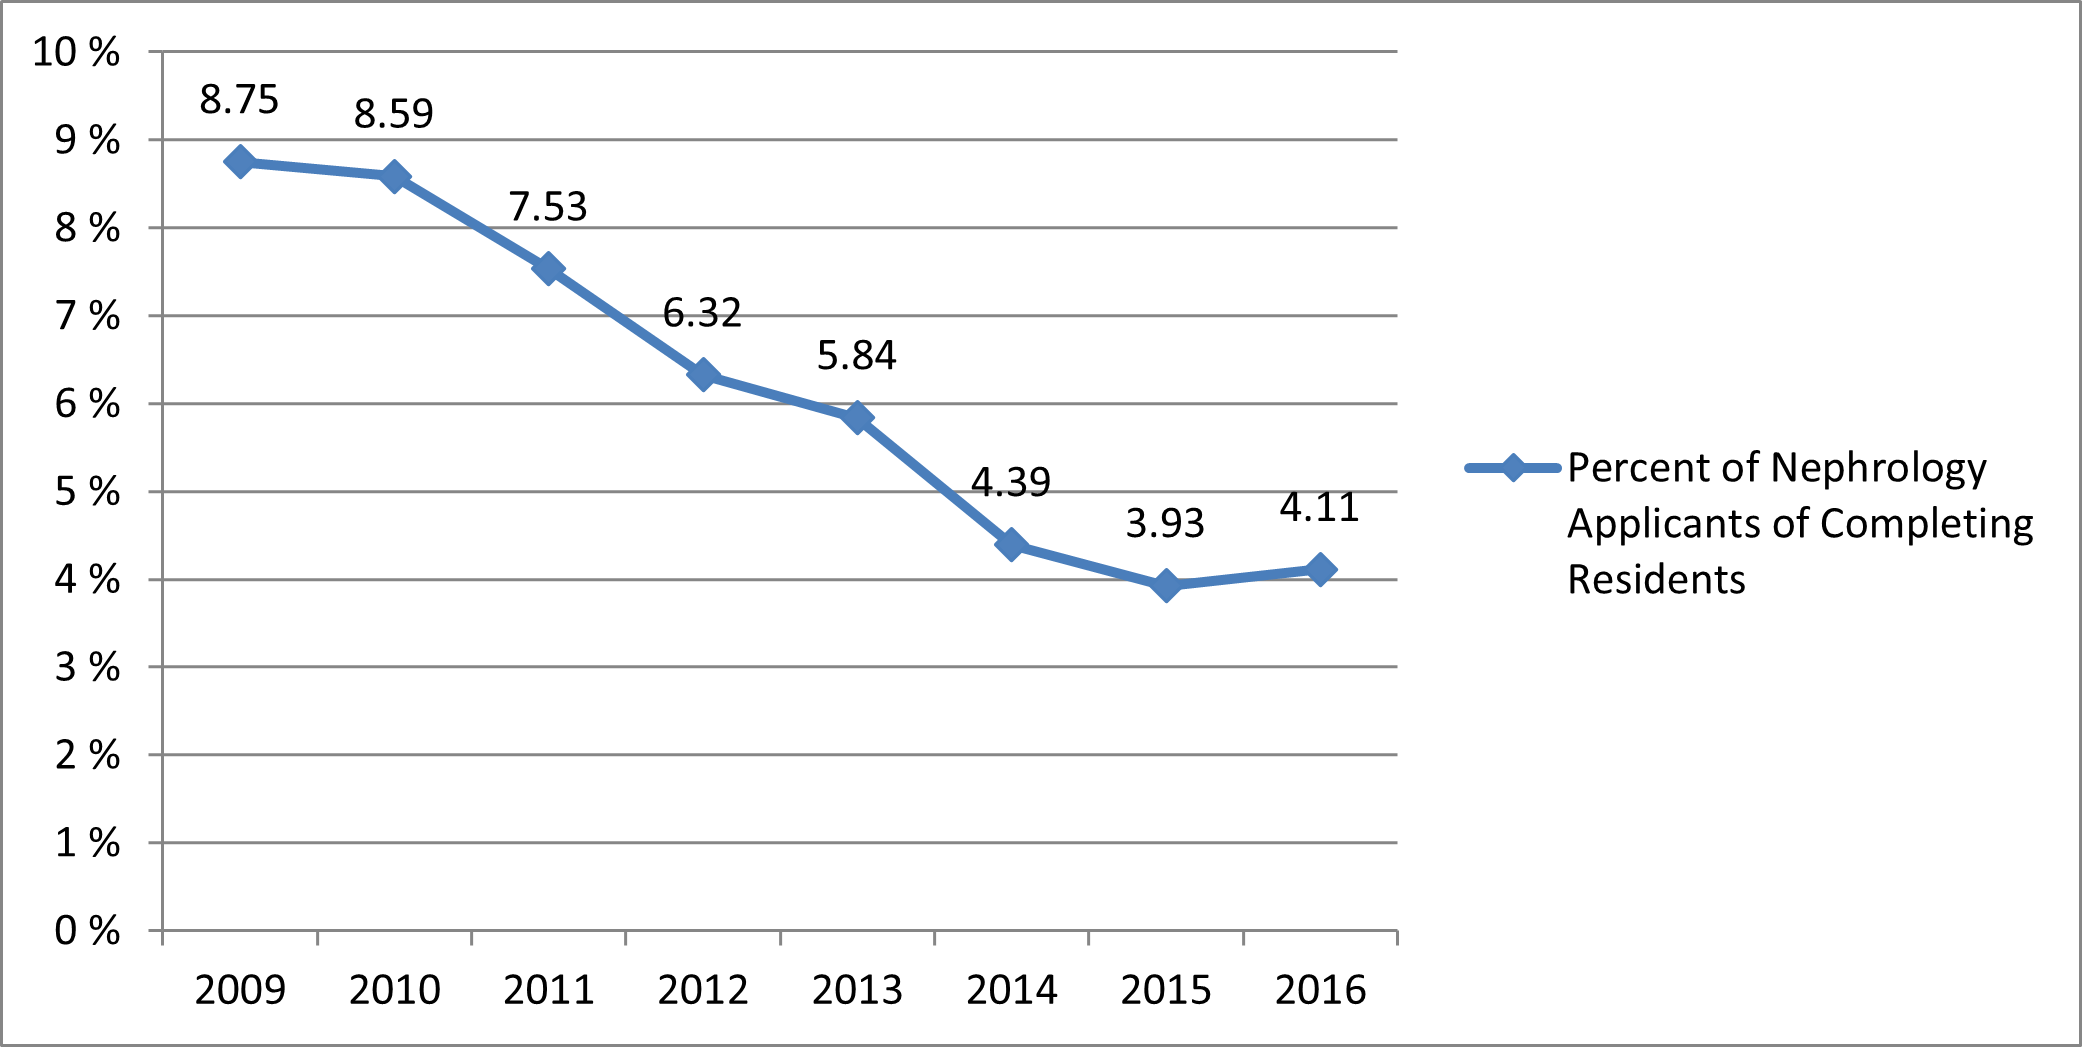
The decrease in applications is seen in the decreasing percent of physicians completing general IM residencies that are applying for a fellowship position in adult nephrology. As seen in Exhibit 13, the percent decreased from 8.75% in 2009/10 to 3.93% in 2015/16. There was a small increase in 2016/17 perhaps reflecting the All-In Policy.
Source: NRMP: “Results and Data: Specialty Matching Service,” various years.
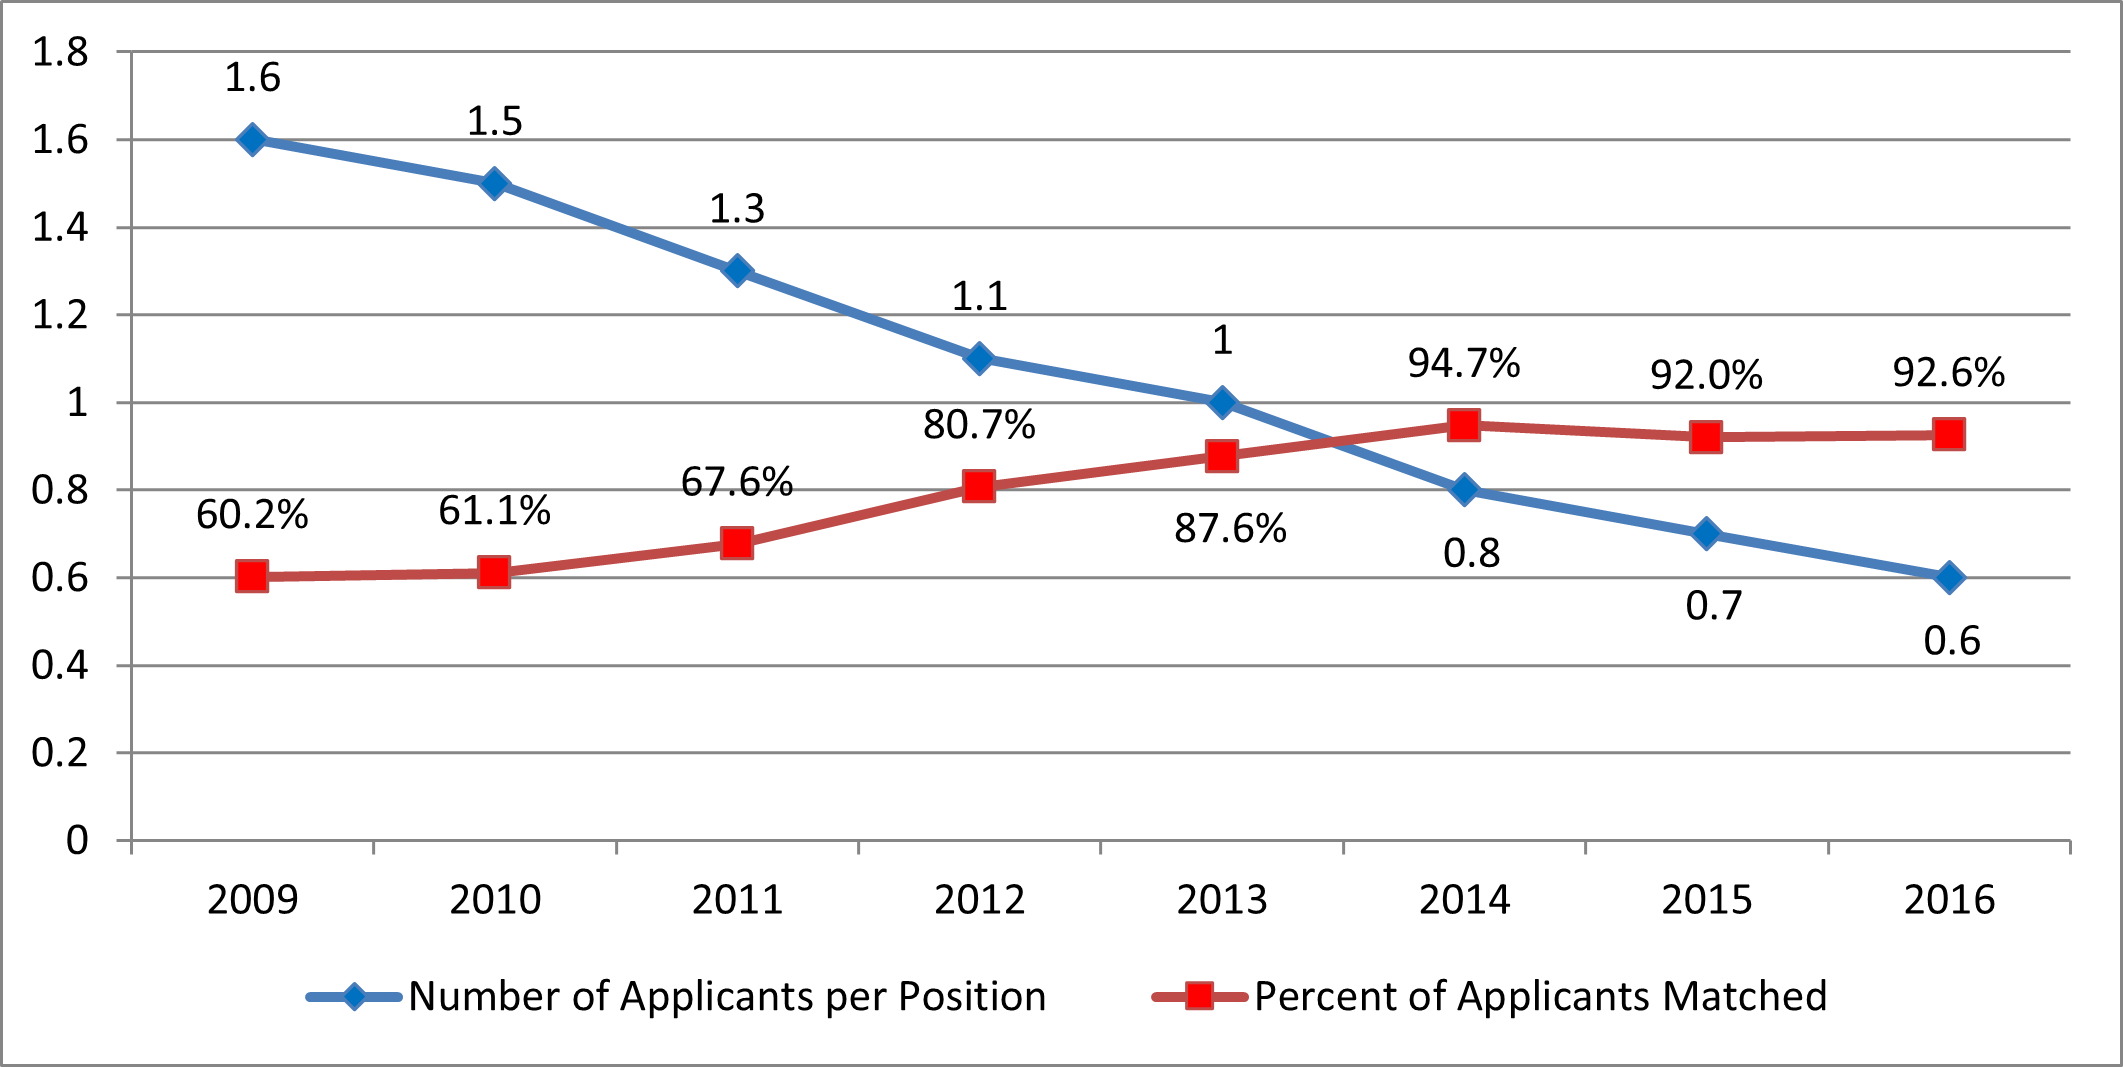
The net effect of the number of positions offered in the Match increasing more rapidly than the number of applicants and matches is that the number of acceptances per available position has continued to decrease to just 6 applications for every 10 positions in the match. One effect is that the vast majority of applicants (92.6% in 2016/17) are able to secure a position and selectivity goes down.
Exhibit 14: Trends in Nephrology Applications and Matches 2009 to 2016
Source: NRMP: “Results and Data: Specialty Matching Service,” various years.
Exhibits 15 and 16 present the distribution of applicants matched though the NRMP SMS by type of medical education. While non-US citizen IMGs are still the single largest source, the number of non-US IMGs has dropped rapidly over the past 4 years, from 189 to 100 (–47%) despite the increase in the number of positions offered. The number of US MDs matched has also decreased over the past 7 years (14%) but most of the decrease occurred earlier in the period. Also noticeable is the large increase in DOs; this may reflect in part the general growing number of DO graduates in the US.
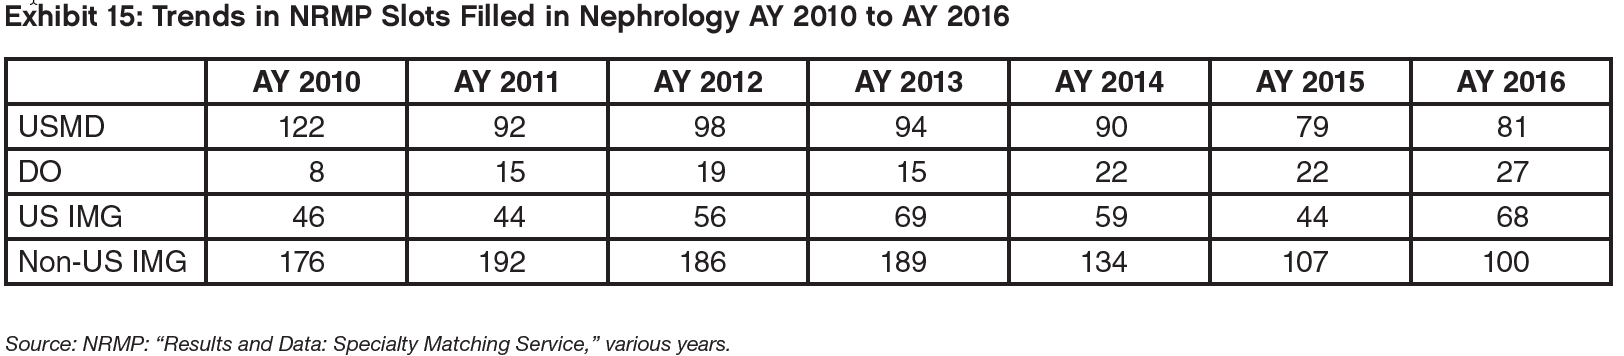
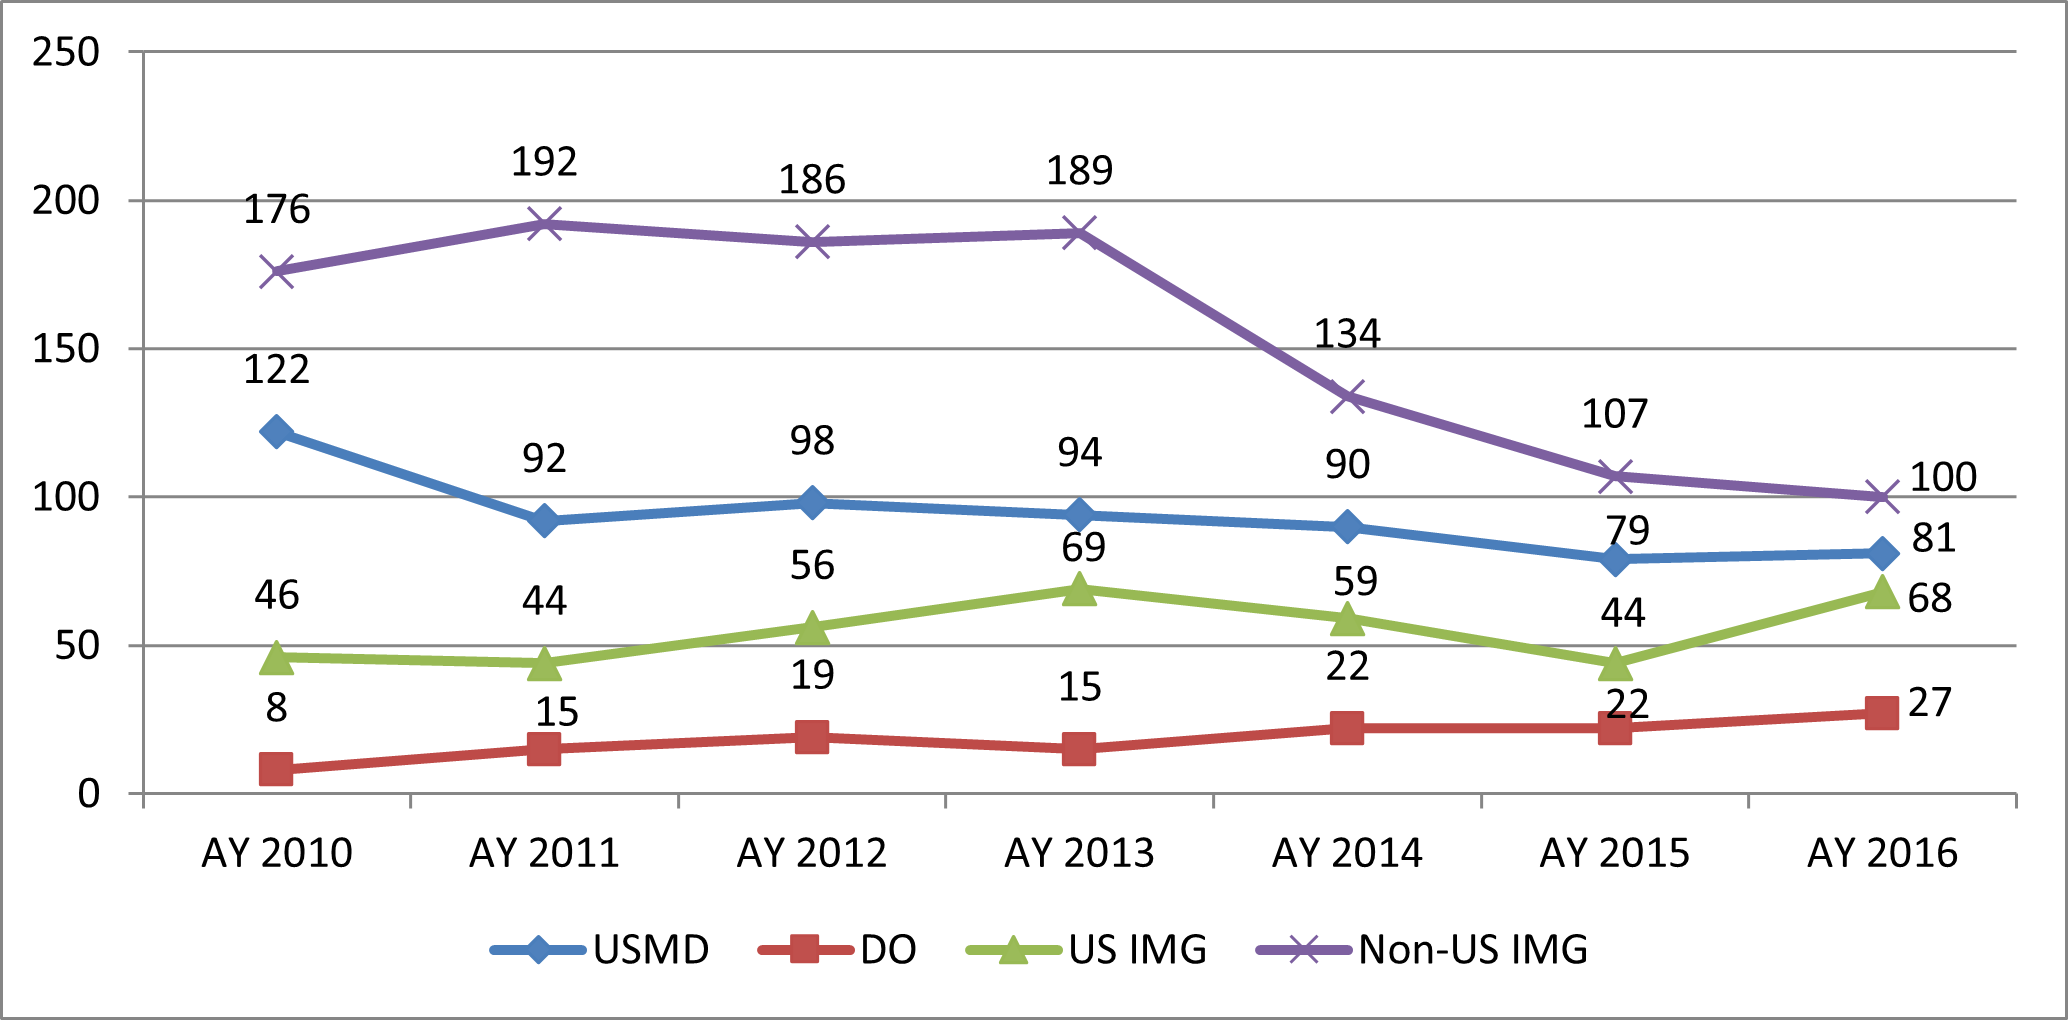
Source: NRMP: “Results and Data: Specialty Matching Service,” various years.
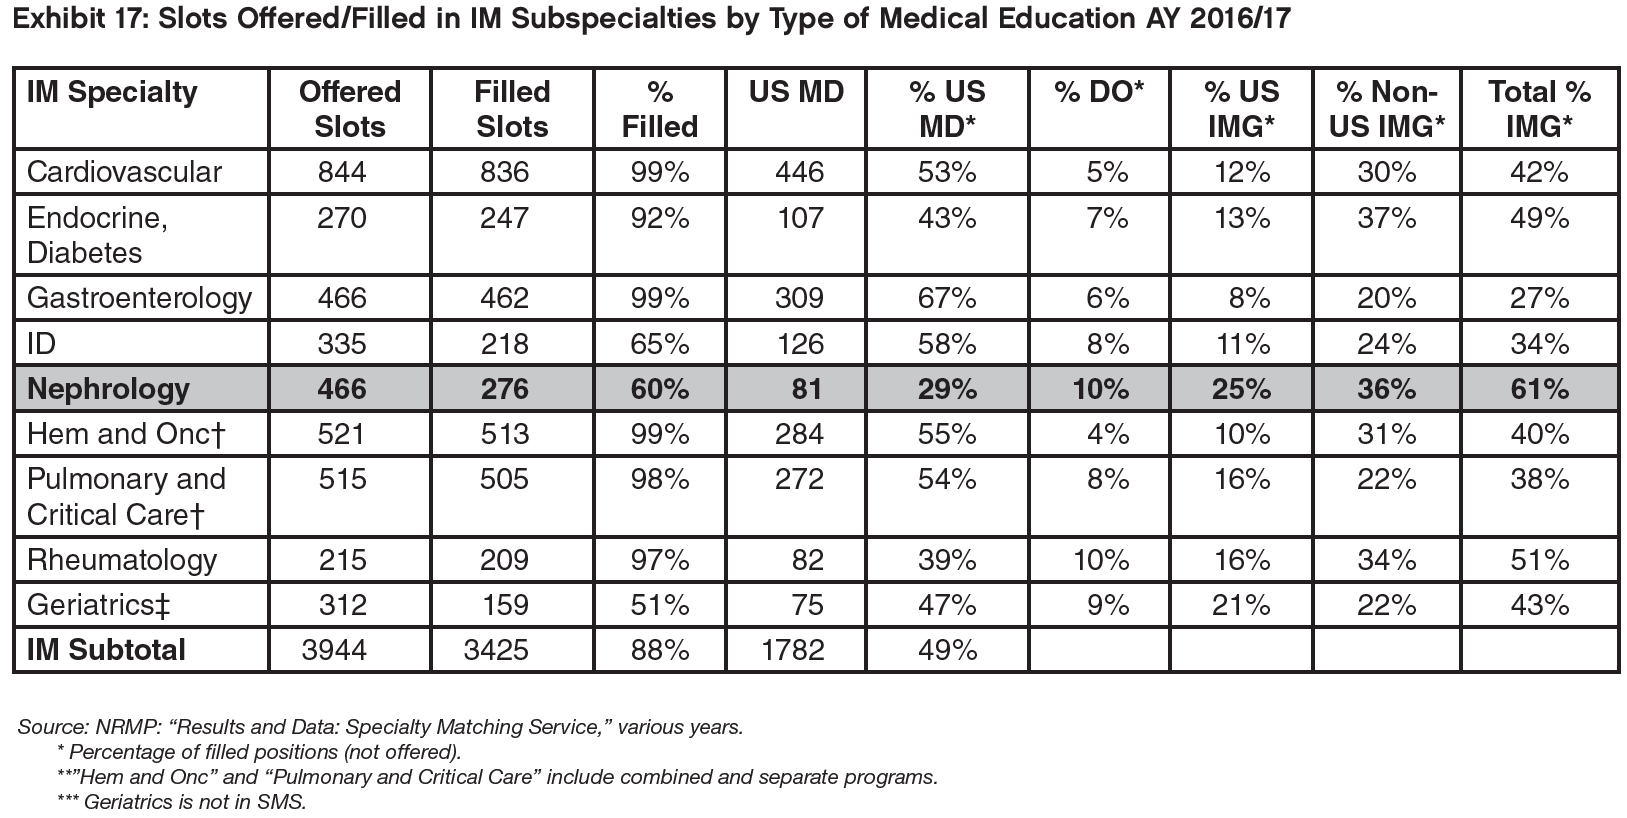
In AY 2016/17 60% of nephrology slots were unfilled. Among the other IM subspecialties only geriatrics filled a lower proportion of NRMP slots; infectious diseases was the only other IM subspecialty filling less than 90% of slots.
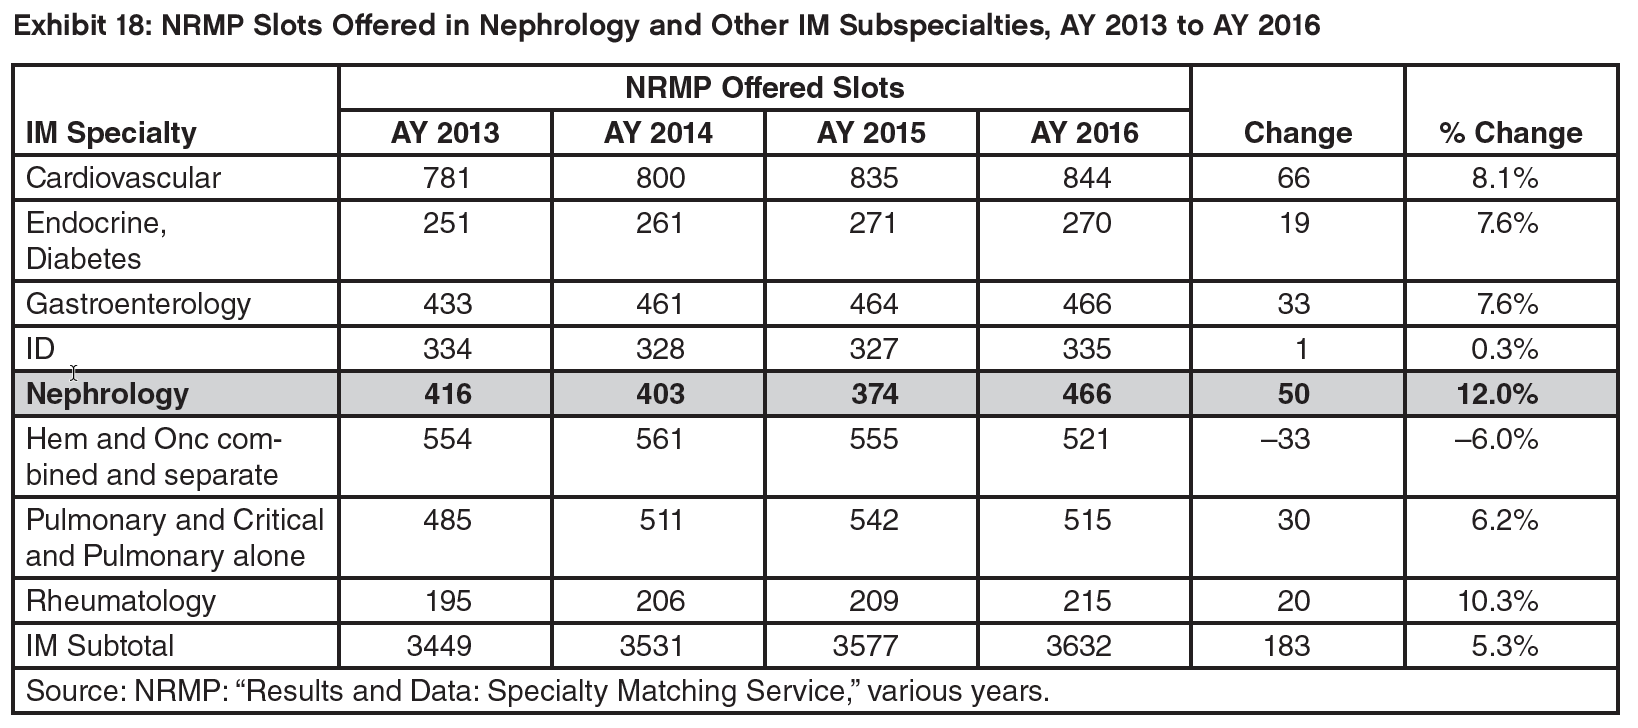
Despite falling application rates, nephrology has increased the number of available NRMP slots offered by 12% since AY 2013, more than any other IM subspecialty. However, all of the increase occurred in AY 2016.
The number of NRMP slots filled in nephrology has fallen by 25%, more than in any other nephrology subspecialty participating in the Match.
C. Results from the Survey of Fellows Completing Training in 2016
Summary
There was some noticeable improvement in nephrology fellows’ assessments of the job market compared to 2015 and 2014. However, the market continues to be significantly more challenging for IMGs than for USMGs. In 2016, the percentage of both USMGs and IMGs completing nephrology fellowship that had searched for a job and indicated that it was difficult to find a satisfactory position declined, but USMGs were significantly less likely to encounter difficulty than IMGs. USMGs were also significantly less likely to report changing their plans because of limited opportunities than IMGs, although the overall percentage changing plans declined slightly since 2015.
There was a significant decrease in the percent of USMGs and IMGs that reported no or very few jobs in the local job market and the views of the national job market improved as well. IMGs applied for high numbers of jobs at about the same rate in 2016 as in 2015, but their likelihood of receiving no job offers declined slightly. The percentage of USMG and IMG nephrology fellows who indicated they would recommend the specialty to residents and medical students increased slightly over 2015. The average income of new nephrologists with confirmed plans (base plus incentive income) was in the range of $190,000 to $195,000.
The 2016 Nephrology Fellows Survey
In May and June of 2016, the GWU Health Workforce Institute worked with ASN to survey all nephrology fellows training in the US. Among the 863 fellows in their first or second year of training in 2015/16, we received 277 responses from first- and second-year fellows for a 32% response rate. We also received 35 responses from fellows in their third year or beyond. According to ASN there were approximately 94 fellows in advanced positions which would be a 37% response rate for this group. To try to understand the job market for nephrologists, for the following analysis we focus on the 190 fellows who were completing their second year of fellowship or beyond (155 fellows completing their second year of training plus the 35 fellows completing a third year or beyond). A more complete analysis of the results of the survey will be presented in a separate report.
We compared the responses of the 2016 cohort to job market experience questions to those of the fellows completing their second year or beyond who responded to the 2014 and 2015 Nephrology Fellow Surveys to try to assess any changes over time. Given the relatively small numbers of respondents and the limited points of comparison, any assessments of possible trends in the responses should be interpreted with caution.
“Did you have difficulty finding a nephrology job you were satisfied with?”
Of the 131 respondents who had actively searched for a position, 53.1% (70 respondents) indicated they had a difficult time finding a satisfactory nephrology job, a slightly lower percentage than in 2014 (56.3%) or 2015 (60.6%). IMGs were significantly more likely than USMGs to report having difficulty finding a satisfactory nephrology job (70.0% vs. 26.0%, p<0.01).
The reasons why USMGs and IMGs reported encountering difficulty finding a satisfactory nephrology position were mostly consistent between 2014, 2015, and 2016. For the USMGs who reported having difficulty in 2016, the most frequently cited reasons were lack of jobs/practice opportunities in desired location (38.5%) followed by overall lack of jobs/practice opportunities (23.1%) and inadequate salary/compensation (15.4%).
For IMGs, the most frequently cited reason for having a difficult time in 2016 was lack of opportunities meeting visa requirements (33.9%), as in 2014 and 2015. The secondmost cited reason for difficulty by IMGs was inadequate salary/compensation (28.6%).
“How many jobs did you apply for?” and “How many job offers did you receive?”
The percentage of USMGs who reported that they applied for 5 or more positions declined from 43.5% in 2015 to 34.0% in 2016 (still greater than 28.6% in 2014). The percentage of IMGs who reported applying for 5 or more jobs held steady at 61.7% (vs. 63.3% in 2015—still greater than 47.4% in 2014). The percentage of USMGs who reported receiving no job offers (4.0%) was similar to 2015 (3.8%). 29.6% of USMGs reported applying to more than 10 positions.
The percentage of USMGs who reported receiving no job offers declined slightly from around 10% in 2014 and 2015 to 6.2% in 2016.
“Did you have to change your plans because of limited nephrology job opportunities?”
Overall, the percentage of respondents indicating that they had changed their plans because of limited nephrology job opportunities declined slightly, from 43% in 2014 and 2015 to 35.4% in 2016. While both USMGs and IMGs were less likely to report changing their plans in 2016 than in prior years, their likelihood of changing plans was significantly different: only 16.0% of USMGs reported that they had to change plans, while 47.5% of IMGs reported changing plans (p<0.01).
For IMGs, the fact that nearly half had to change their plans due to limited job opportunities may reflect a relative lack of job opportunities that meet visa requirements, which may force many IMGs to practice outside of their preferred locations or settings.
Perceptions of the local and national job market
Survey respondents were asked to indicate their perceptions of the local job market (within 50 miles of where they trained) and the national job market. Response options ranged from no jobs to many jobs. Key findings include:
Perceptions of the local and national job markets were more positive in 2016 compared to 2014 and 2015 for both USMGs and IMGs;
As in 2014 and 2015, the 2016 fellows were more likely to indicate that there were few or no job opportunities in the local job market compared to the national market; and
USMGs have a far more favorable view of the local and national markets than IMGs.
“Would you recommend nephrology to current medical students and residents?”
The overall percentage of fellows as well as both USMGs and IMGs who said they would recommend nephrology to current medical students and residents was slightly higher overall in 2016 than it had been in 2014 and 2015. As in 2014 and 2015, IMGs were less likely to recommend the specialty than USMGs.
Income
In prior reports we presented income as a range of $25,000 increments which made it hard to differentiate between subgroups or across years. For this year’s report, income is presented as an ‘average’ income calculated based on midpoints of income ranges that were used in the survey. The new approach requires assumptions about how income is distributed within each income range, but these seem to be reasonable assumptions while the results—if used with caution—offer better information on income differentials.
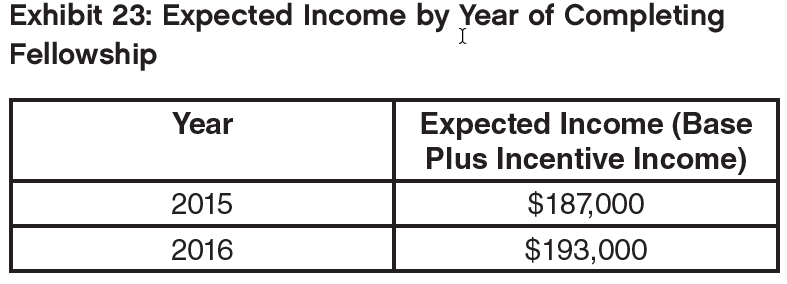
To ensure compatibility across years the new methodology was applied retrospectively to 2015 data in the inter-year comparison (Exhibit 23) which shows an increase of about 3% in expected income between 2015 and 2016, from $187,000 to $193,000. (The figures do not include income from second job as only about 10% of respondents said they had a second position in medicine.)
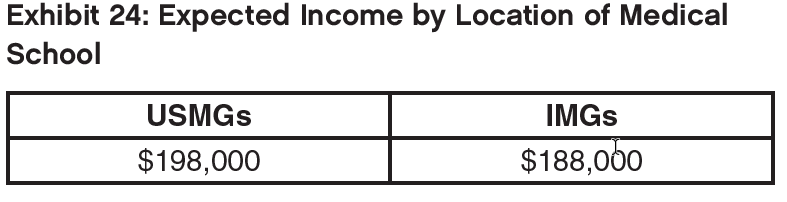
USMGs were found to have an average expected income about $10,000 higher than IMGs at around $193,000.
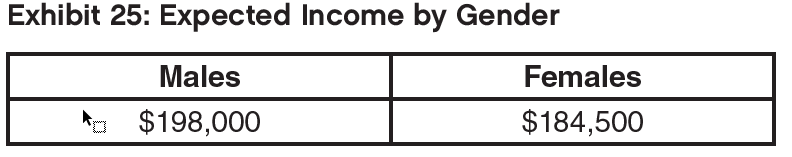
Males were found to have an expected income about $13,500 higher than females at around $198,000.
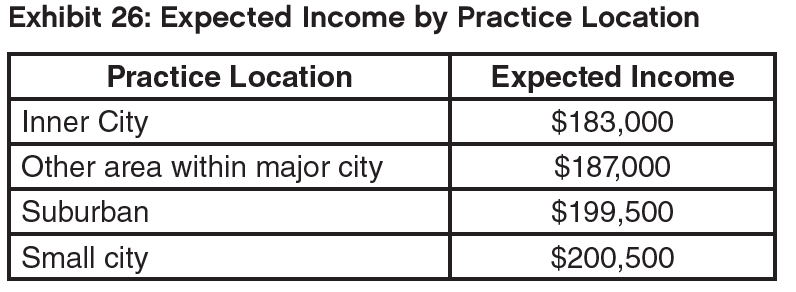
Incomes were highest in suburban and small city locations (around $200,000), with the lowest incomes in inner cities, about $17,000 lower than in suburban and small city locations.
The report on the results of the 2016 fellows survey to be completed later this year will delve into greater detail on some of the possible reasons for the above differences in income, such as hours worked, setting and region.
4. Results of the Survey of Practicing Nephrologists 55 and Older
Summary
The survey of nephrologists aged 55 and over suggested that they are generally quite satisfied with most aspects of their career achievements and benefits. Many of them have secured relatively high incomes, although more so for males than females. Even at this later stage of life they work long hours, although this might not be entirely by choice, and many would explore part-time hours if this option were more widely available. Most indicated they planned to work until their late 60s or early 70s.
Respondents felt that the range of patient care they provided had increased over the past 5 years, despite a trend towards reduced hours with aging, and more of them reported being less satisfied with medicine than reported being more satisfied compared to 5 years ago.
The 2016 Nephrology Midcareer and Retirement Survey
In April and May of 2016 the GWU Health Workforce Institute worked with ASN to survey nephrologists aged 55 and over. From the 2593 invitations sent out based on ASN records 525 responses were received for a 20% response rate. To try to understand the current practice patterns and retirement plans of nephrologists in this age group we focus on the 383 nephrologists who indicated in their responses that they were Board Certified in the Internal Medicine (adult) nephrology subspecialty and were still active in nephrology. (Three respondents who indicated they were Board Certified in both pediatric and adult nephrology were excluded from this stage of the analysis.) Where it was of interest, further investigation by sex, age, and location of medical school (“IMG status”) was carried out. A more complete analysis of the results of the survey will be presented in a separate report.
Practice Patterns
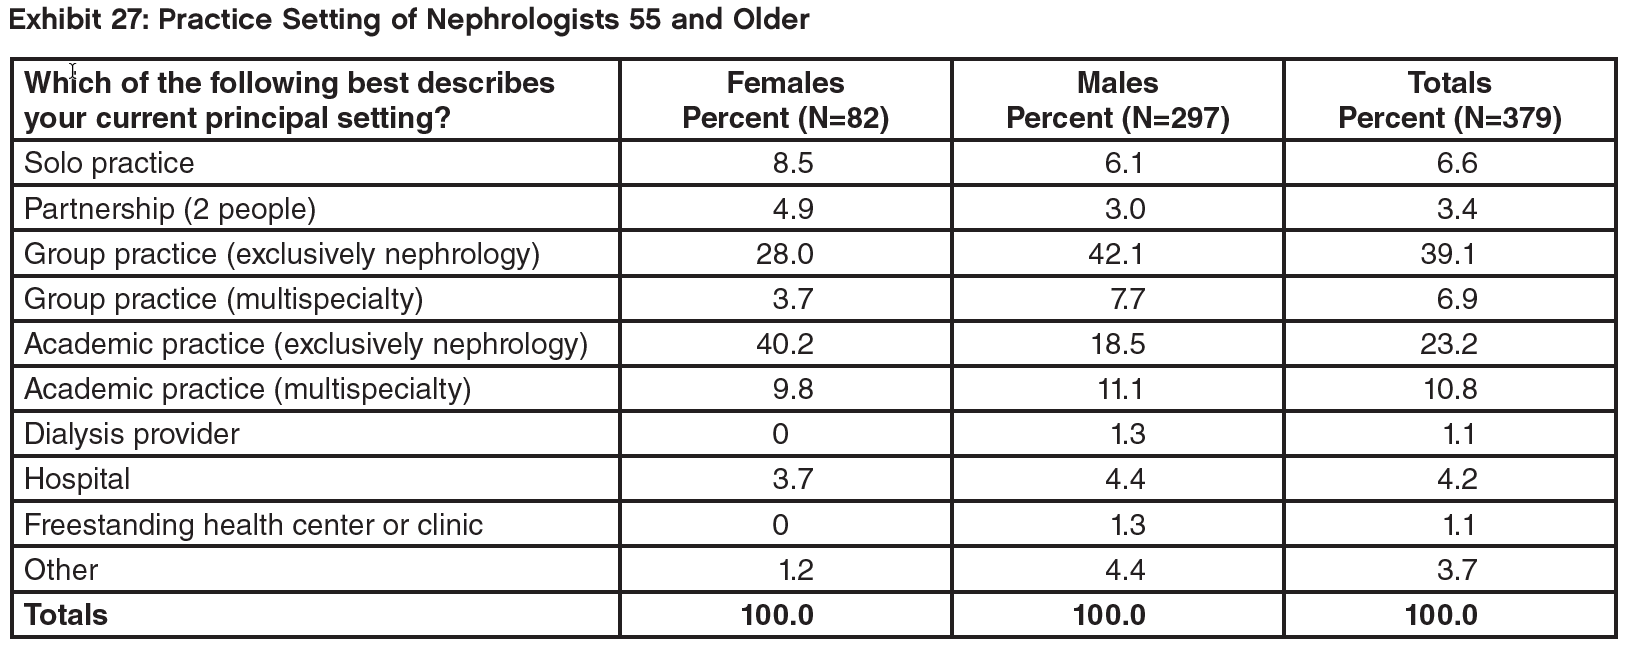
Most respondents were either in group practices (39% in exclusively nephrology practices, 46% including practices that did not focus exclusively on nephrology); a further 34% were in academic practice (again, mostly exclusively focused on nephrology). Breaking the results down by sex showed that females are more likely to be in solo or partner practices or in academic nephrology settings; males are more likely to be in group practices. Breaking the results down by age showed that older nephrologists (70 years and over, 14% of respondents) were more likely to be in academic practice (again, mainly exclusively nephrology) or hospital settings; younger respondents (under 70 years) were more likely to be in a group practice, mainly in exclusively nephrology group practices.
Work Patterns
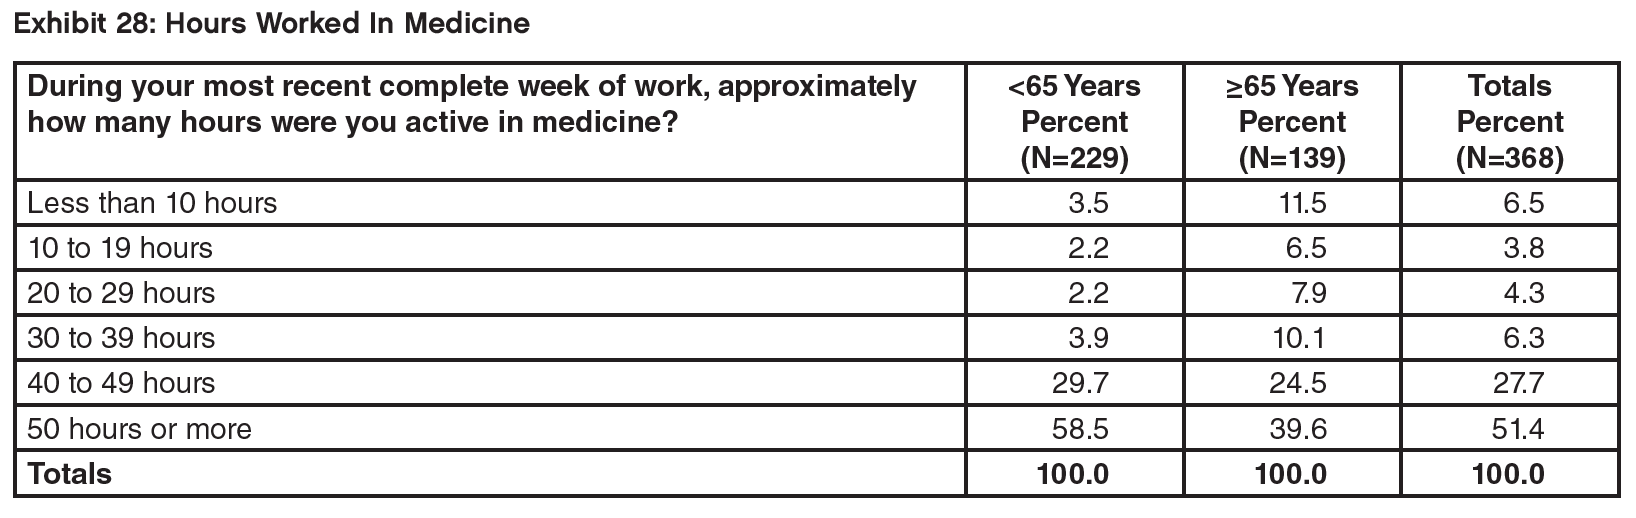
Although this is an older age group, almost four-fifths of respondents (79%) indicated they were working 40 or more hours per week. Although there was a downward trend of working hours with age, even among those aged 65 to 69 74% were still working 40 hours or more. In most cases (86%) those hours were being spent exclusively in nephrology (Exhibit 28).
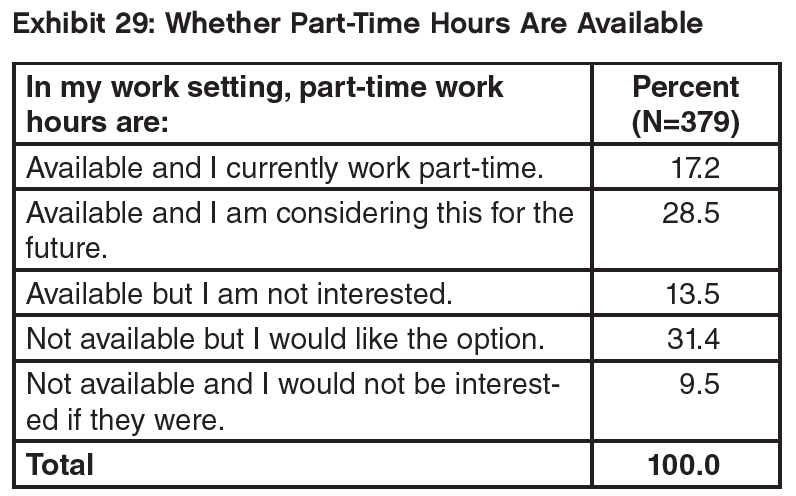
Respondents indicated substantial interest in working part time, without current availability, across all the age groups (31.4%). Increasing adoption of part time hours with age was also evident in the age analysis from 6% in the 55–59 age group to 52% in the 70 years and over group. There were no discernible differences in part-time working or interest in it by age or IMG status (Exhibit 29).
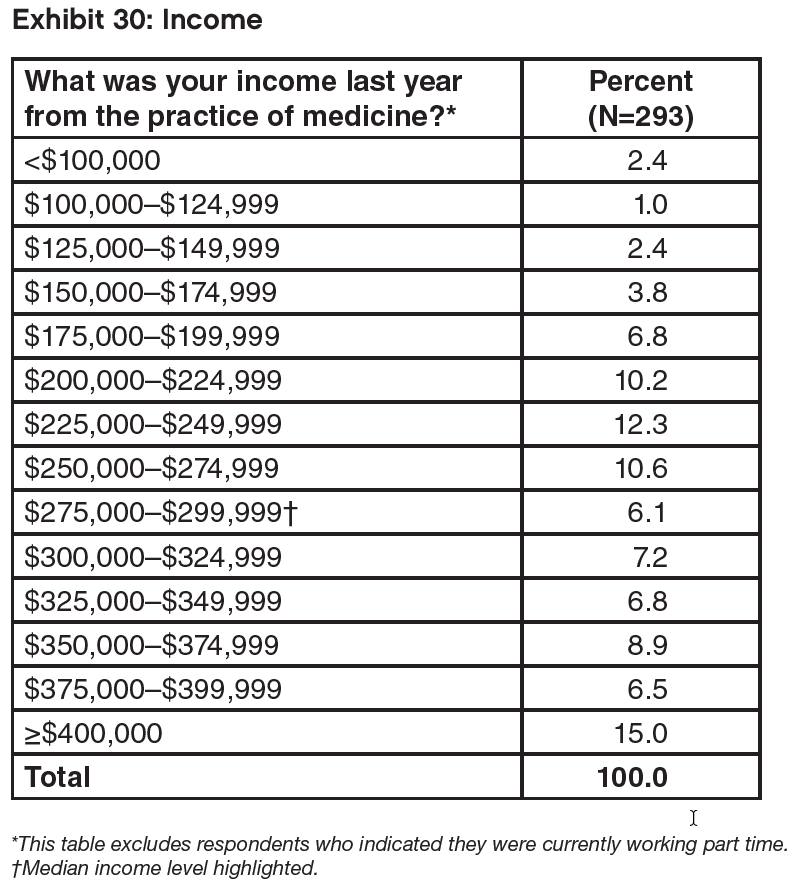
The median income was in the range $275,000–$299,999, with 44% of respondents reporting an annual income of $300,000 or more and 15% reporting an income above $400,000. The median income for males was higher than for females ($275,000–$299,999 range vs. $225,000– $249,999 range), while the median income for IMGs was higher than for USMGs ($275,000–$299,000 range vs. $250,000–$274,999 range).
More respondents reported that their patient care hours had increased rather than decreased over the past 5 years (38% vs. 24%). Older age groups were more likely than younger age groups to view patient care as having decreased over the last 5 years, and younger age groups more likely than older age groups to perceive patient care as having increased. This is consistent with other data indicating a reduction in working hours with age.
A question about changes in time spent in hospitals with patients showed that whereas the 55–60 age group have seen their hospital patient hours increase over the past 5 years, older respondents were increasingly more likely with age to see their hospital patient-hours decrease.
A majority of respondents (52%) said they were somewhat or much less satisfied with medicine compared to 5 years ago. Only 18% were more satisfied.
Retirement Plans
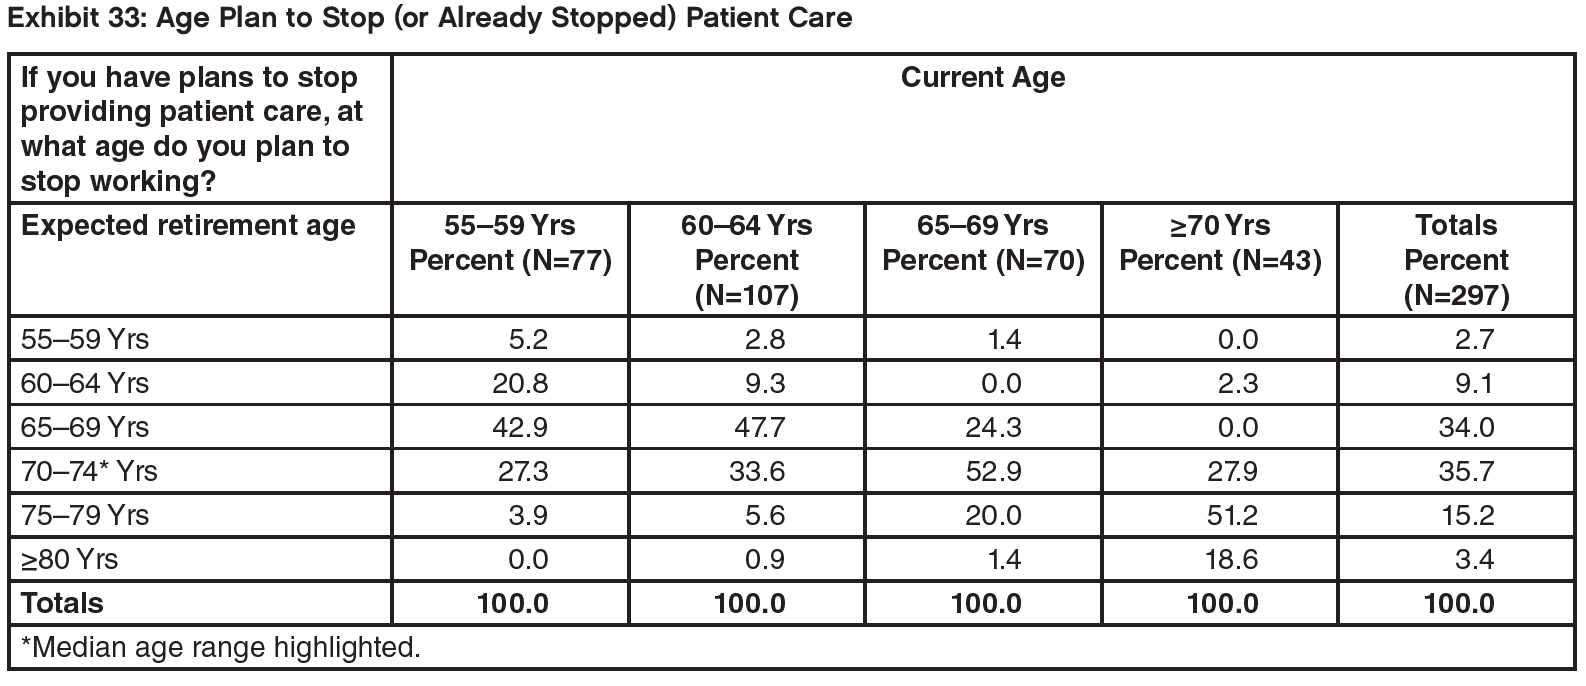
The median age range for planned retirement from patient care was in the 70–74-year age range. However, only a quarter (26%) reported that they would retire today if they could afford to (Exhibit 34).